XRP Price Chart Suggests Run to $3.20 Is Possible Despite Recent Correction
In the last seven days, XRP has faced a notable correction, which is in line with the broader market condition. But today, the XRP price chart has displayed something that will gladden the hearts of the altcoin holders.
This pattern, currently observed, led the token’s price to break out toward $2.90 earlier. Will a similar thing happen?
The Token Wants to Repeat History
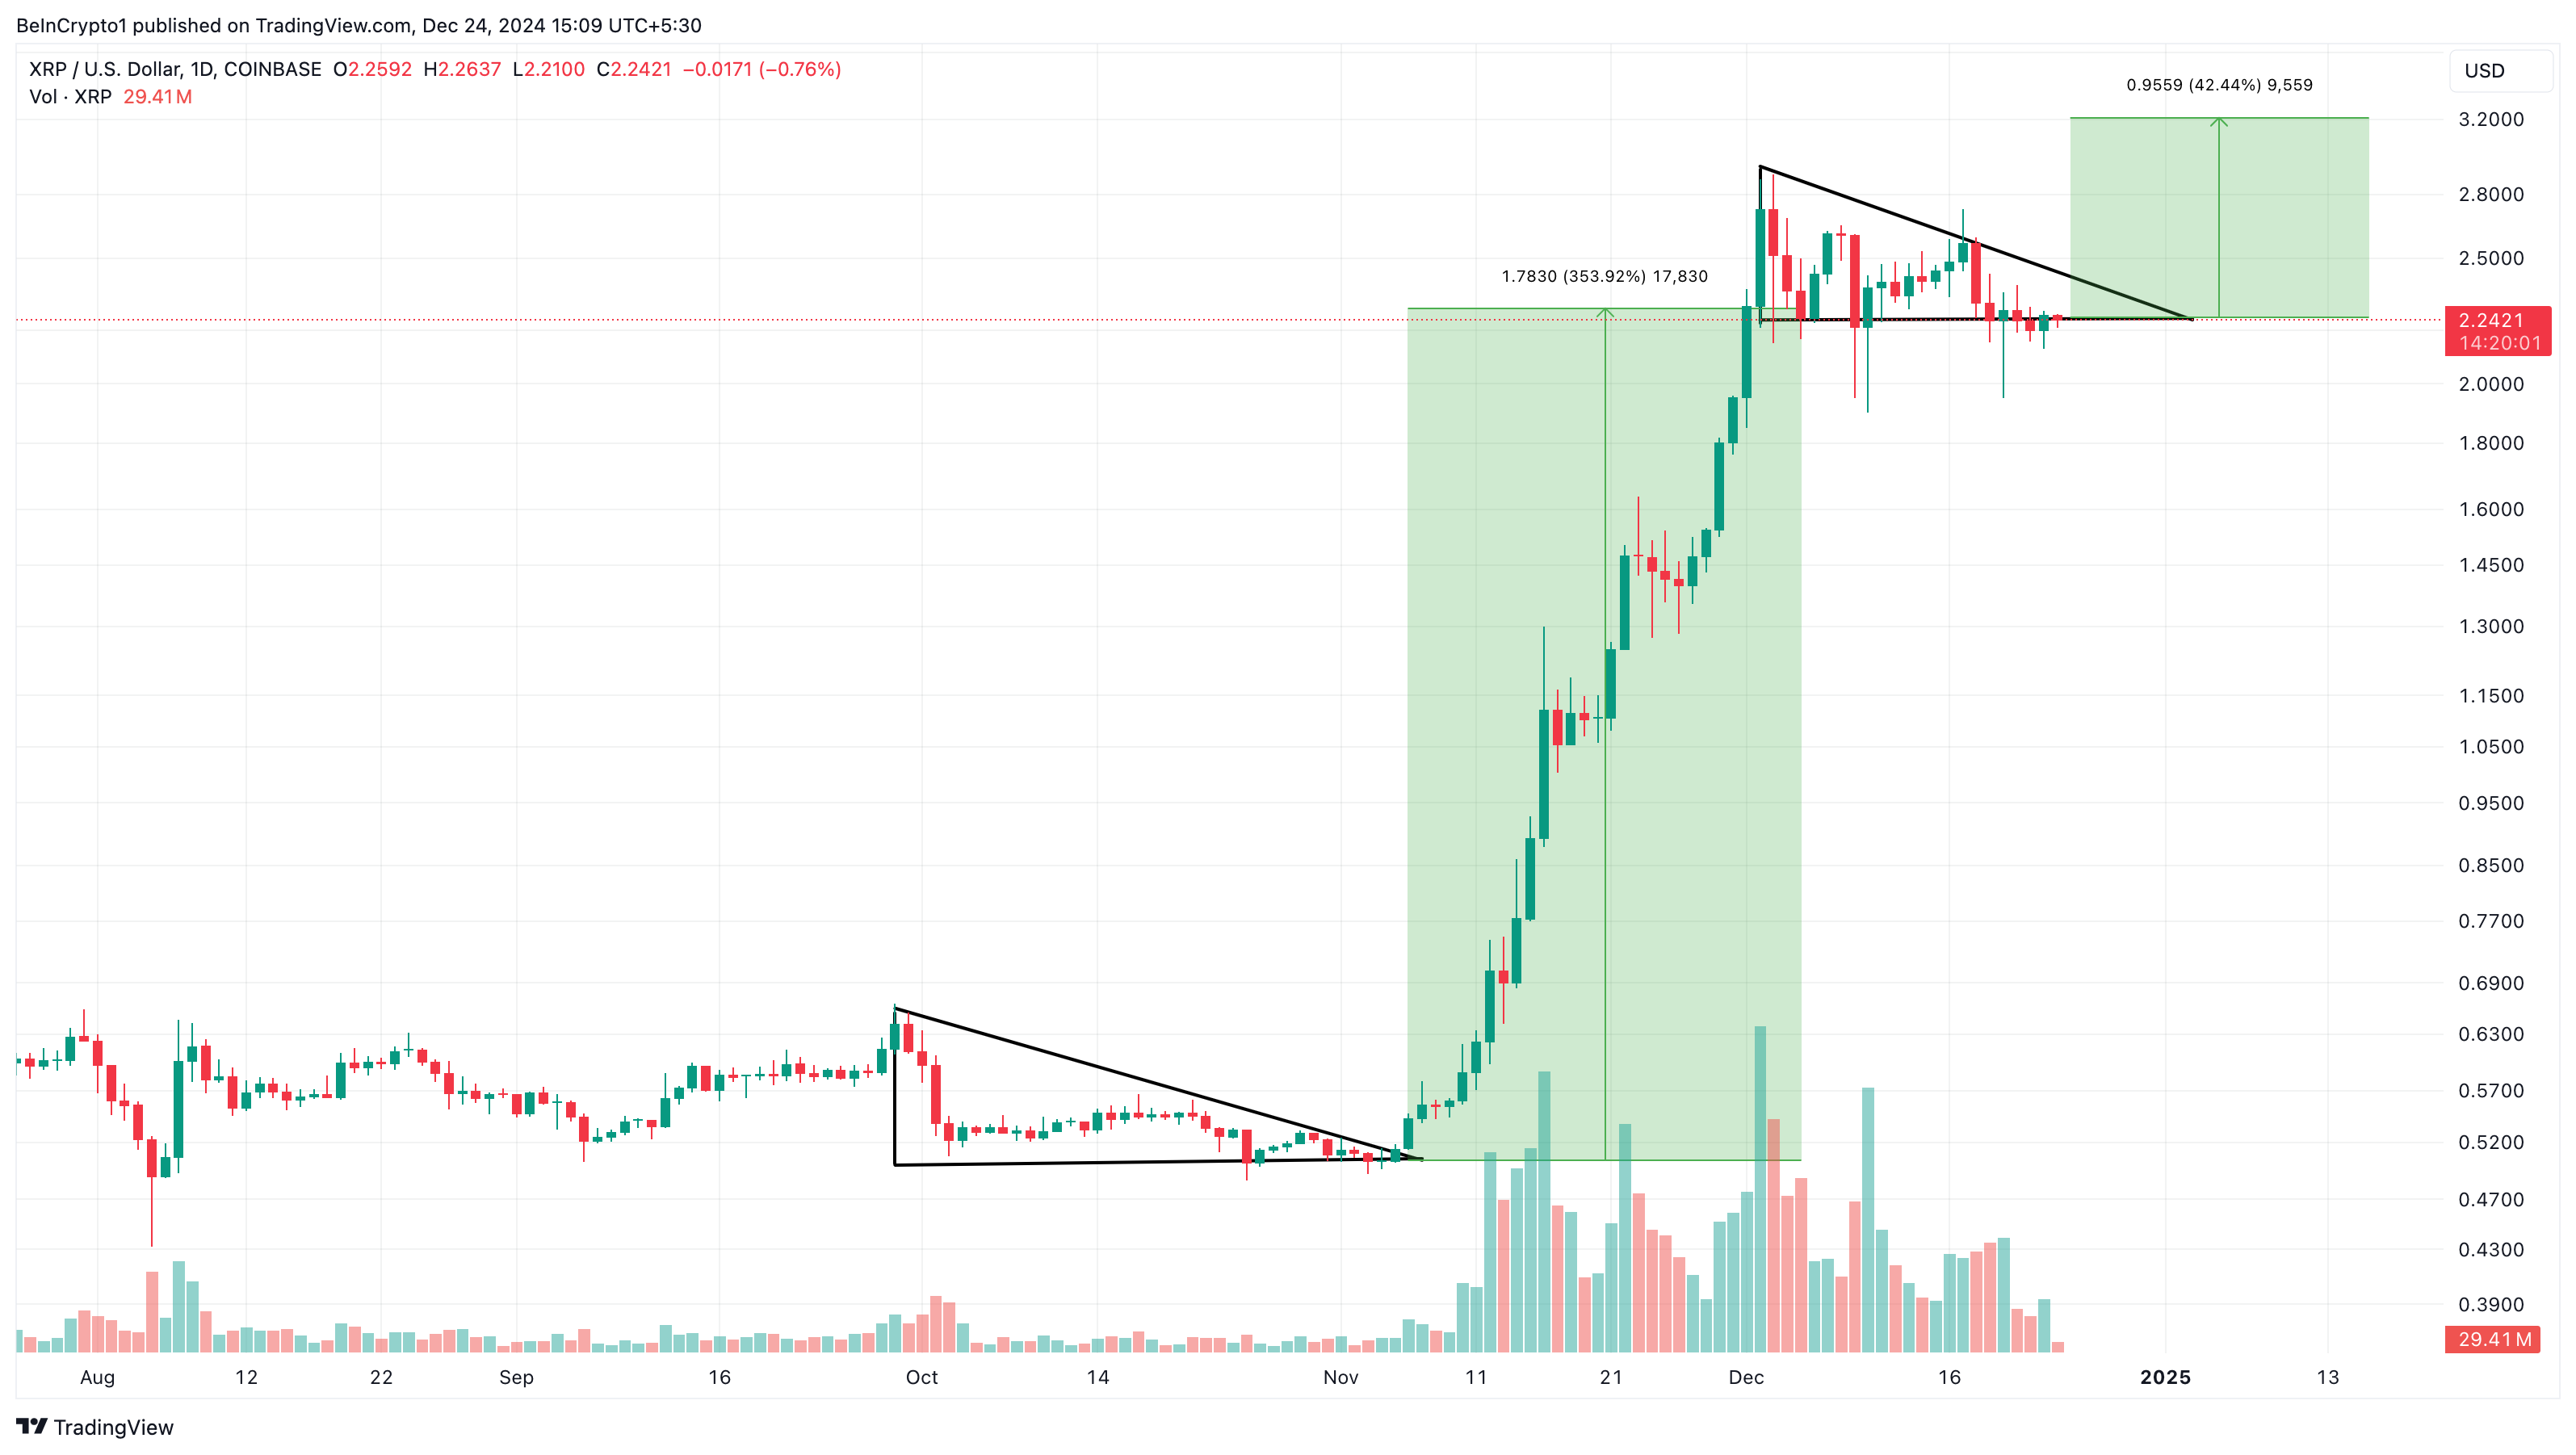
Between September 29 and November 6, XRP’s price moved within a descending triangle. This bearish chart pattern features a descending upper trendline and a flatter, lower horizontal trendline.
When the price dips below the horizontal line, it usually continues to decline. Conversely, breaking above the upper trendline often triggers a significant upswing. Around November 7, XRP broke out of this pattern, leading to a remarkable 350% price surge.
The daily chart shows the token forming another descending triangle. If history repeats itself, the altcoin’s value could experience another substantial climb.
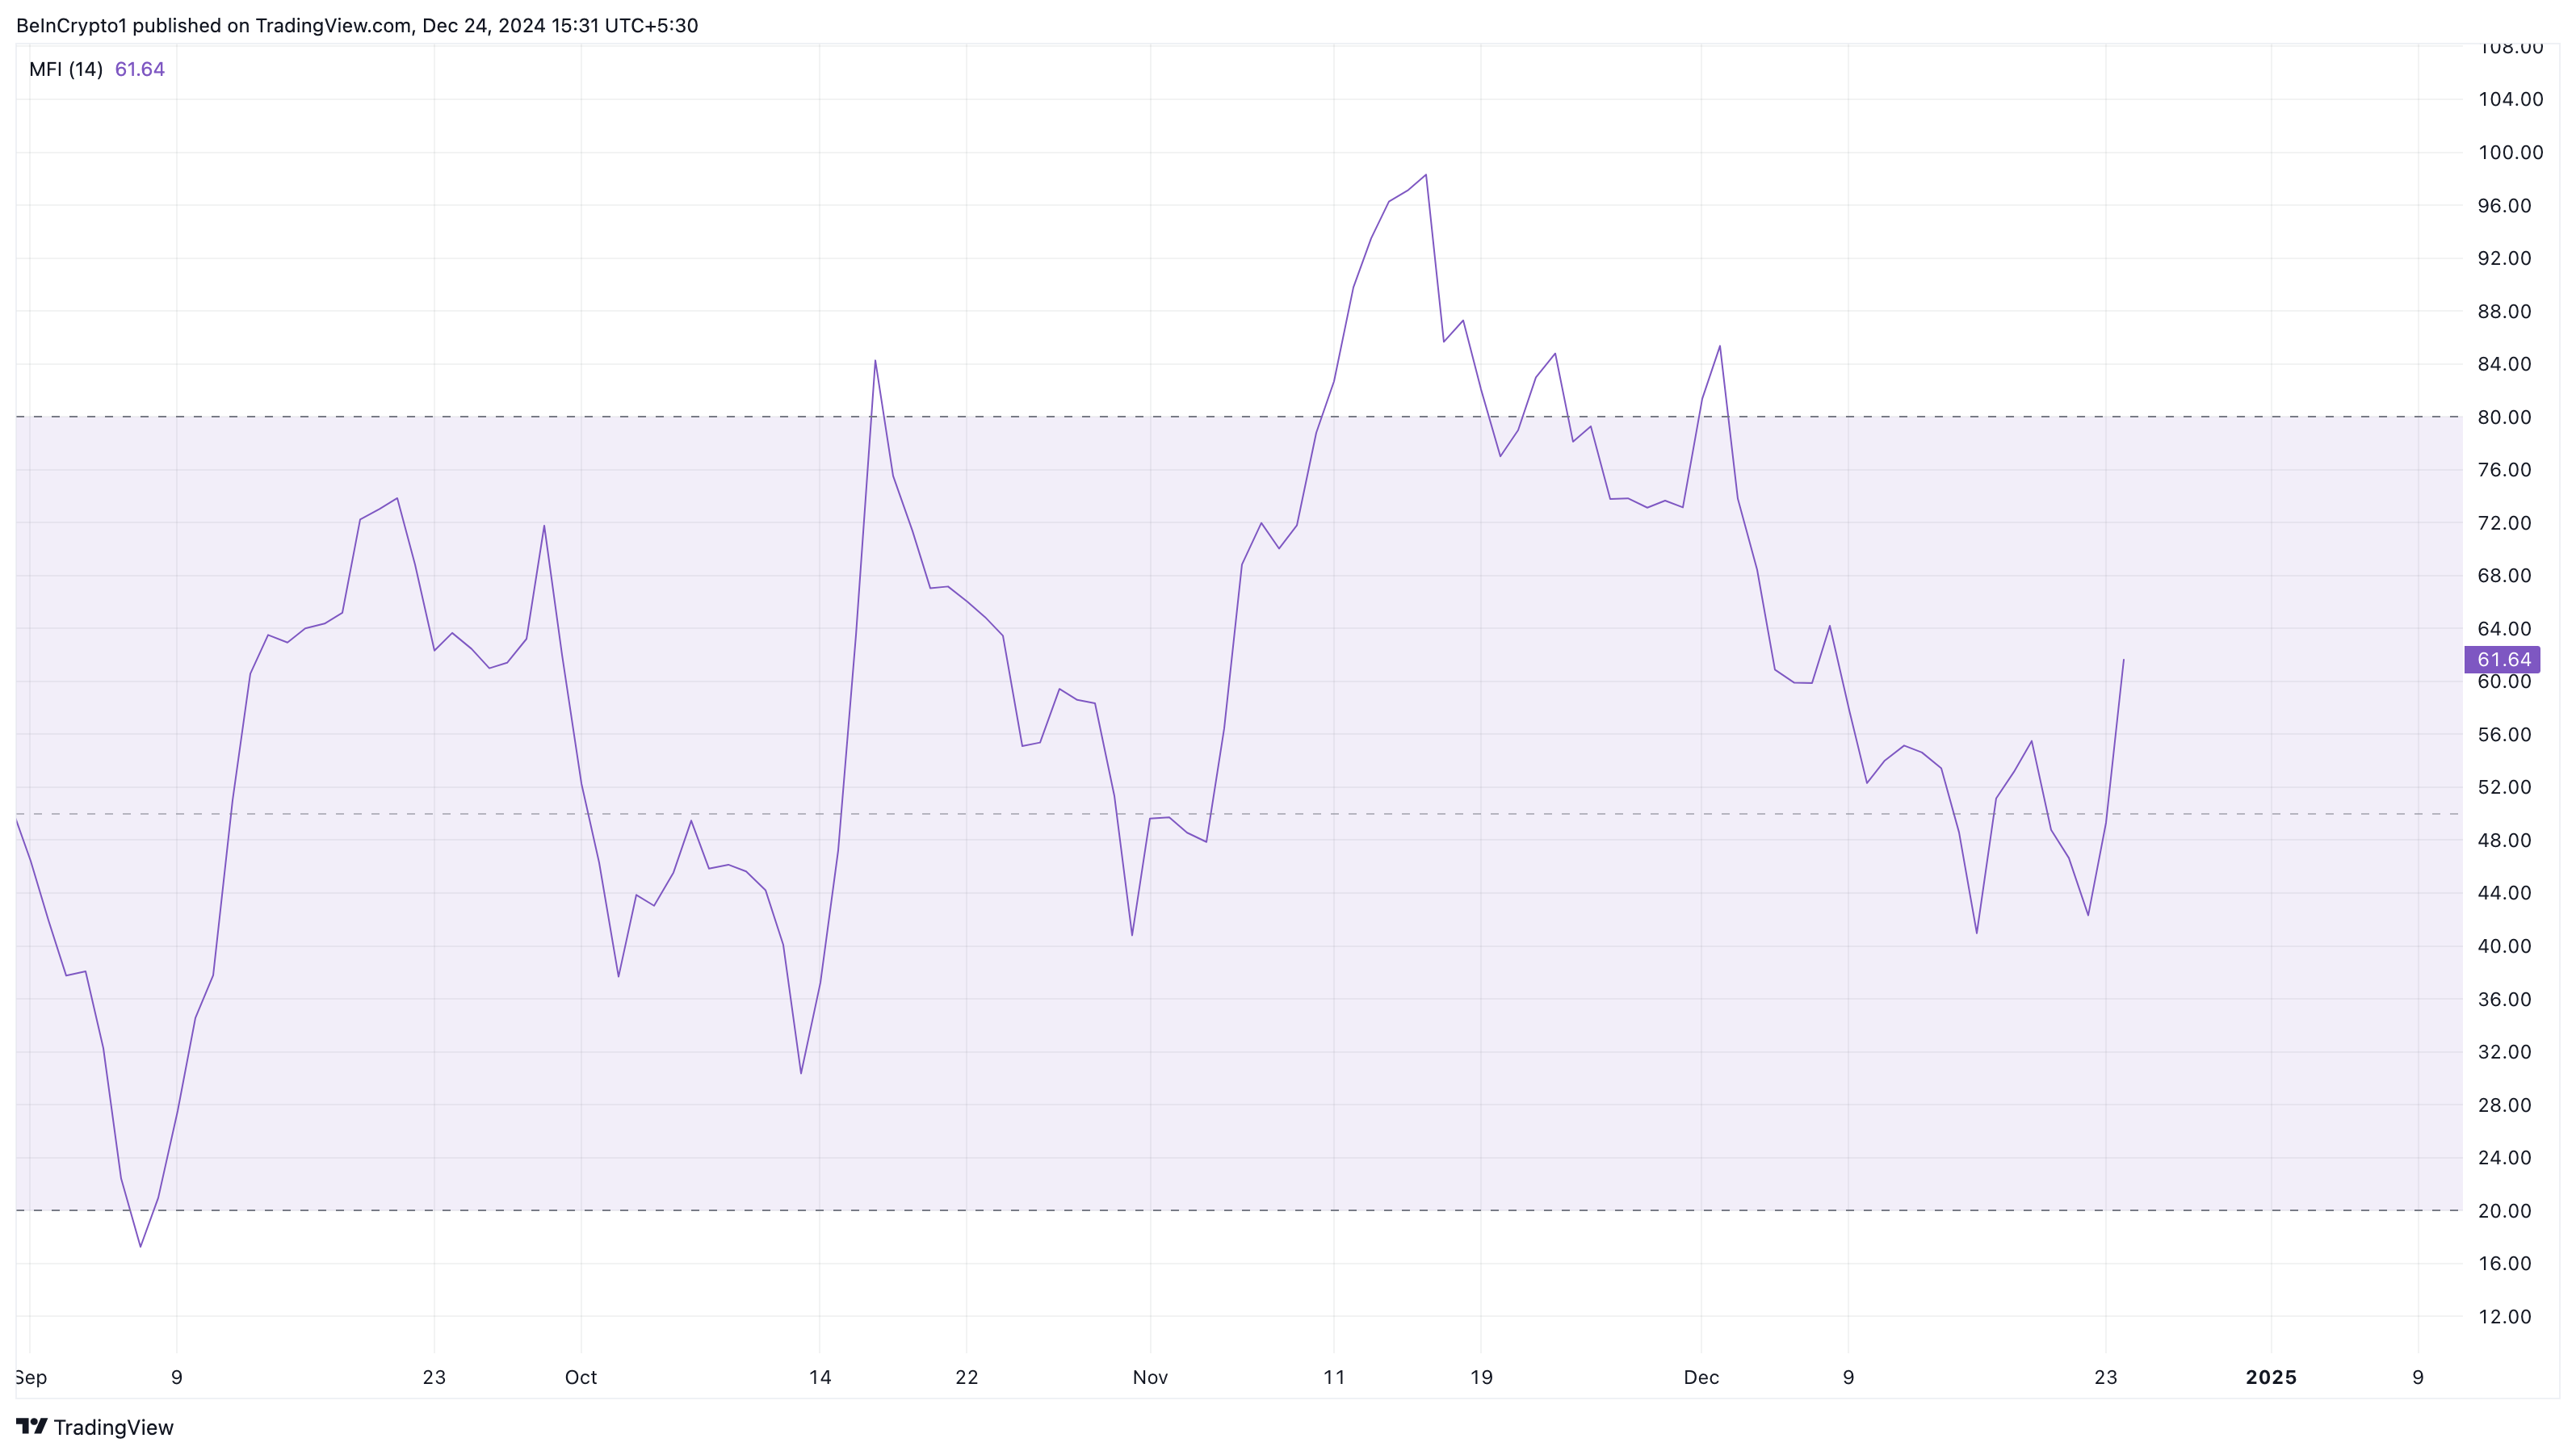
Another indicator supporting this bias is the Money Flow Index (MFI). The MFI measures buying and selling pressure by analyzing the cryptocurrency’s price and volume.
This indicator fluctuates between 0 and 100. Typically, when the MFI exceeds 80, the asset is overbought, indicating that it could be time to sell. On the other hand, when the reading is below 20, it means it is oversold, and it could be time to buy.
As of this writing, the MFI has risen from 42.05 to 61.64, indicating significant buying pressure around XRP. Should this continue, the altcoin might climb significantly above $2.24.
XRP Price Prediction: 43% Hike Possible
A look at XRP price action shows that the cryptocurrency has been consolidating between $2.20 and $2.72 since December 3. This suggests indecision between buyers and sellers.
However, with the MFI rising, the trend might change to the upside in the short term. At the same time, XPR faces overhead resistance at $2.90. To surpass this hurdle, buying pressure needs to be more intense than it currently is on the XRP price chart.
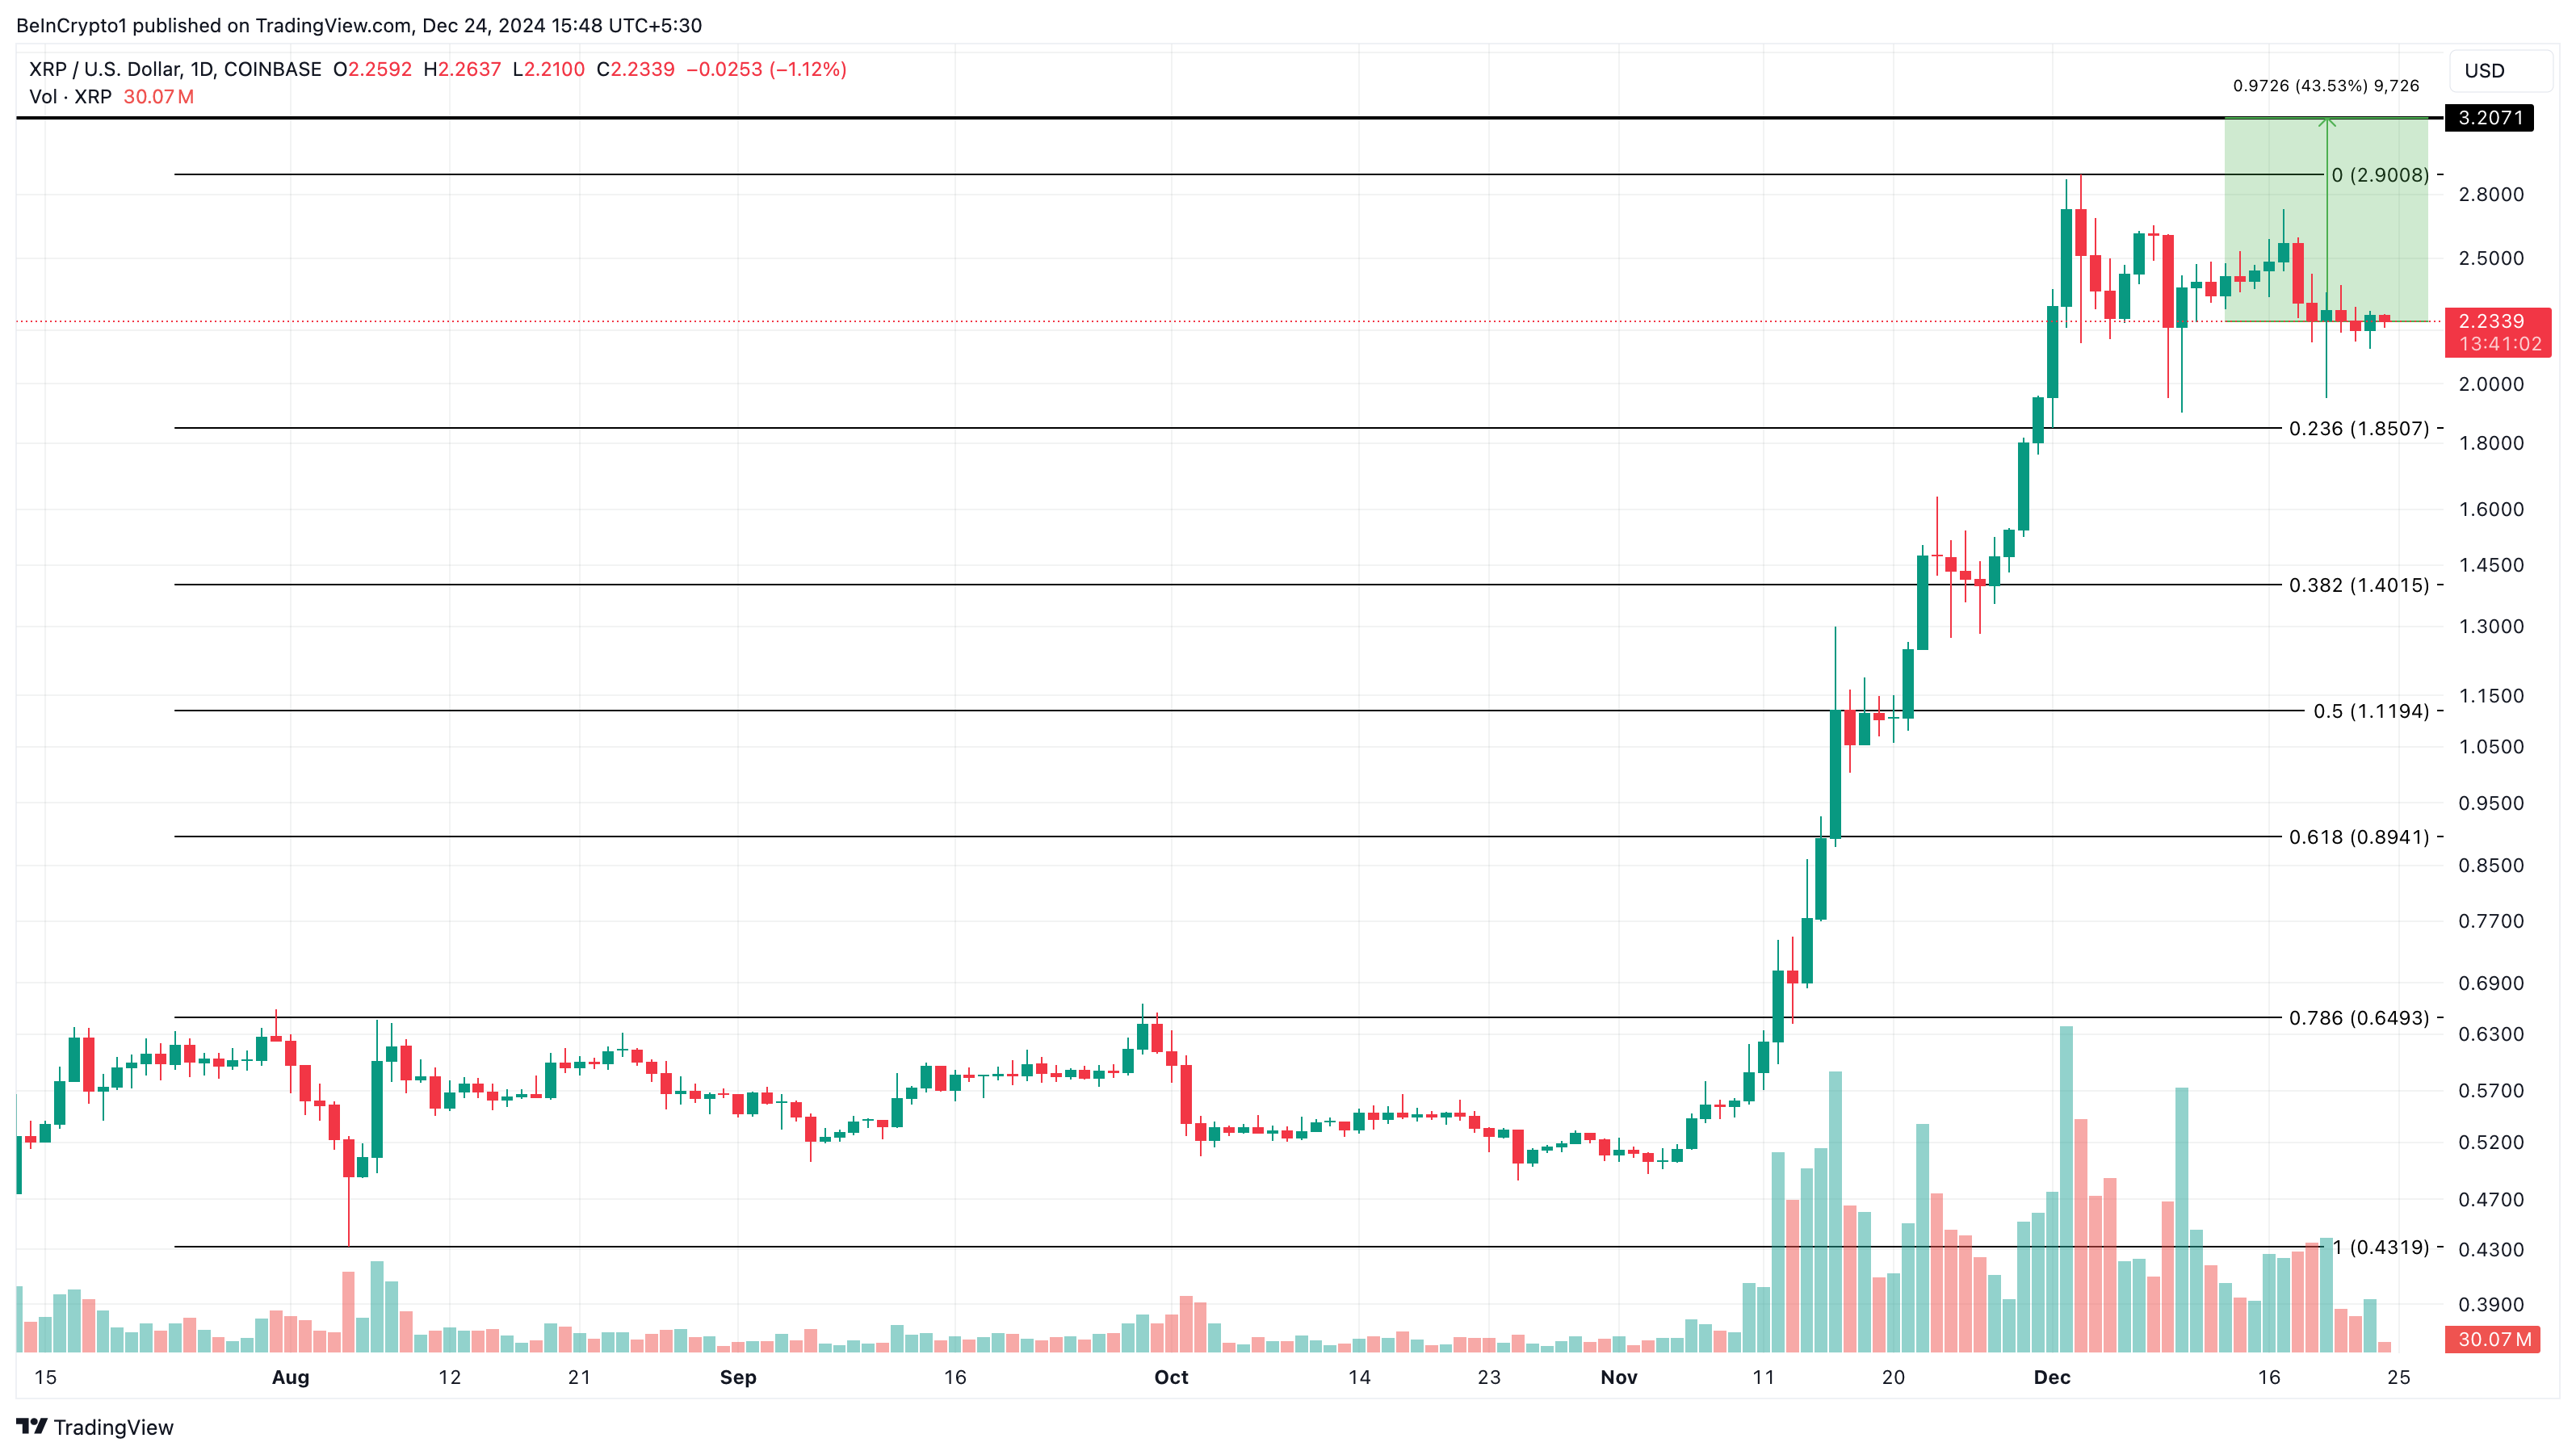
If that is the case, then the altcoin’s value might climb by 43.53% toward $3.20. On the other hand, failure to rise above the $2.90 resistance might invalidate this prediction. In that scenario, XRP’s price might decline to $1.40.
免責聲明:投資有風險,本文並非投資建議,以上內容不應被視為任何金融產品的購買或出售要約、建議或邀請,作者或其他用戶的任何相關討論、評論或帖子也不應被視為此類內容。本文僅供一般參考,不考慮您的個人投資目標、財務狀況或需求。TTM對信息的準確性和完整性不承擔任何責任或保證,投資者應自行研究並在投資前尋求專業建議。
熱議股票
- 1
- 2
- 3
- 4
- 5
- 6
- 7
- 8
- 9
- 10