PFXF: Preferred Stocks ETF Beating Peers, Yet Unattractive
designer491
PFXF strategy
VanEck Preferred Securities ex Financials ETF (NYSEARCA:PFXF) started investing operations on 07/16/2012 and tracks the ICE Exchange-Listed Fixed & Adjustable Rate Non-Financial Preferred Securities Index. It has 99 holdings, a 30-day SEC yield of 6.59% and a total expense ratio of 0.40%. Distributions are paid monthly.
As described in the prospectus by VanEck, the underlying index "is comprised of U.S. exchange-listed hybrid debt, preferred stock and convertible preferred stock issued by non-financial corporations". Preferred stocks have priority over common stocks in the payment of dividends and proceeds of liquidation, but are generally junior to debt and do not carry voting rights. They are considered hybrid assets and their price behavior is between stocks and bonds. Eligible securities must be primarily traded on the NASDAQ or NYSE and have at least $250 million face amount outstanding and one day to maturity. The index is capitalization-weighted and rebalanced monthly. The portfolio turnover rate in the most recent fiscal year was 27%.
PFXF portfolio
About one third of asset value has an investment grade rating, mostly at the lower end (BBB). More than one third of assets is not rated.
Credit risk profile based on S&P rating % of assets (Chart: author, data: VanEck)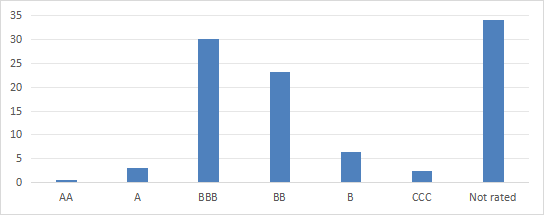
The portfolio is quite concentrated. The top 10 issuers, listed in the next table, represent 56.9% of asset value. Each of them has several securities in the PFXF portfolio. The top 2 names, AT&T (T) and NextEra Energy (NEE) weigh about 10%.
Issuer | Weight% |
AT&T Inc | 10.06% |
NextEra Energy | 10.01% |
$Public Storage(PSA-N)$ | 6.60% |
5.24% | |
SCE Trust (group) | 4.84% |
Ford Motor Co | 4.71% |
Albemarle Corp | 4.37% |
4.35% | |
3.47% | |
Duke Energy Corp. | 3.27% |
Performance
PFXF share price has lost 11% since inception, as plotted on the next chart. In the same time, the cumulative inflation was about 37%, based on the Consumer Price Index. Therefore, long-term shareholders have suffered a large loss in inflation-adjusted value.
PFXF share price return (Seeking Alpha)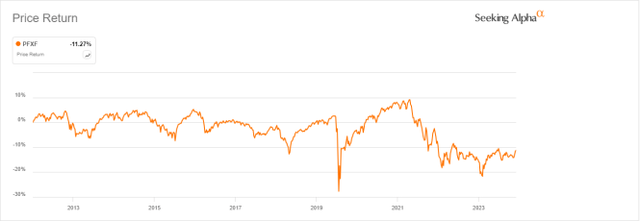
Distribution history is rather flattish (next chart). The annual sum of distributions increased from $1.23 per share in 2013 to $1.35 in 2023. It represents for shareholders an income growth of 9.8% in 10 years, while the cumulative inflation was over 30% in the same time.
PFXF distribution history (Seeking Alpha)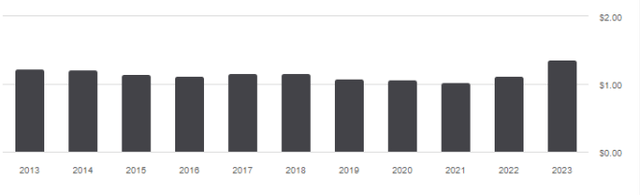
Since 8/1/2012, PFXF has outperformed a high-yield bond benchmark, represented by iShares iBoxx $ High Yield Corporate Bond ETF (HYG). However, the gap in annualized return is only 76 bps, and it shows a significantly higher risk measured in volatility and maximum drawdown, resulting in a lower risk-adjusted performance (Sharpe ratio in the table below).
Total Return | Annual.Return | Drawdown | Sharpe ratio | Volatility | |
PFXF | 79.79% | 4.97% | -35.49% | 0.38 | 10.41% |
HYG | 64.68% | 4.21% | -22.03% | 0.41 | 7.31% |
PFXF vs competitors
The next table compares characteristics of PFXF and the three largest preferred stocks ETFs:
- iShares Preferred and Income Securities ETF (PFF)
- First Trust Preferred Securities and Income ETF (FPE)
- Invesco Preferred Portfolio ETF (PGX)
PFXF | PFF | FPE | PGX | |
Inception | 7/16/2012 | 3/26/2007 | 2/11/2013 | 1/31/2008 |
Expense Ratio | 0.41% | 0.46% | 0.84% | 0.50% |
AUM | $1.82B | $14.77B | $5.46B | $4.37B |
Avg Daily Volume | $9.13M | $110.36M | $17.46M | $37.81M |
Yield TTM | 7.21% | 6.20% | 5.56% | 5.86% |
Div. Growth 5 Yr CAGR | 4.08% | -0.75% | -2.09% | -2.83% |
PFXF is the smallest fund in this list (in assets under management) and the least liquid (in dollar volume). However, it looks more attractive than its peers regarding the yield, 5-year dividend growth and expense ratio. The next chart plots total returns, starting on 2/12/2013 to match all inception dates. PFXF is the best performer, shortly ahead of FPE.
PFXF vs. Competitors, total return since 2/12/2013 (Seeking Alpha)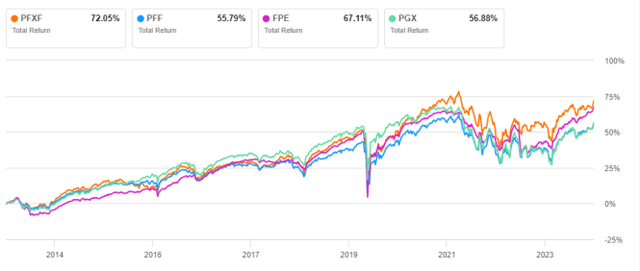
In fact, none of these funds looks compelling: their share prices lost between 11% and 20% in this time interval. FPE was marginally better than PFXF at preserving value.
PFXF vs. Competitors, price return since 2/12/2013 (Seeking Alpha)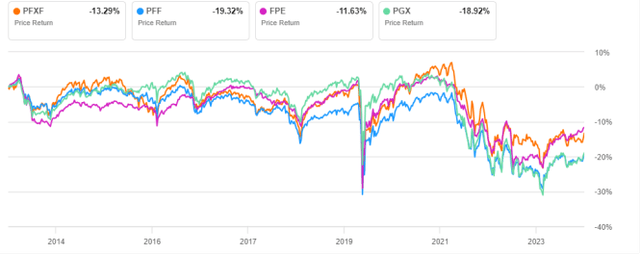
PFXF is lagging the pack over the last 12 months, mostly due to sector rotation. Financials are the GICS sector with the highest 12-month momentum, as reported in my latest S&P 500 dashboard. Consequently, excluding them is a disadvantage in this time frame.
PFXF vs. Competitors, 12-month total return (Seeking Alpha)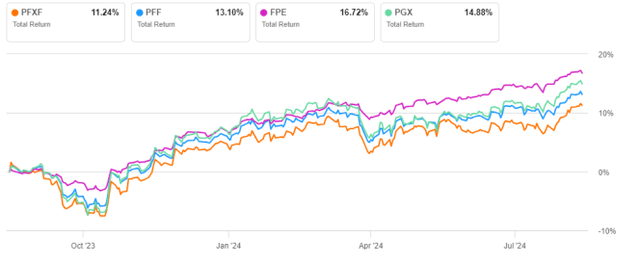
Takeaway
VanEck Preferred Securities ex Financials ETF is invested in US-traded preferred stocks of non-financial companies. It is quite concentrated in its top issuers and about two thirds of assets are below investment grade. PFXF has outperformed its most popular competitors and a high-yield bond index since 2013. However, its slow price decay and flattish distribution history make it quite unattractive.
免责声明:投资有风险,本文并非投资建议,以上内容不应被视为任何金融产品的购买或出售要约、建议或邀请,作者或其他用户的任何相关讨论、评论或帖子也不应被视为此类内容。本文仅供一般参考,不考虑您的个人投资目标、财务状况或需求。TTM对信息的准确性和完整性不承担任何责任或保证,投资者应自行研究并在投资前寻求专业建议。
热议股票
- 1
- 2
- 3
- 4
- 5
- 6
- 7
- 8
- 9
- 10