YYY: Long-Term Decay And Excessive Expense Ratio
D-Keine/iStock via Getty Images
Since my first sell rating on Amplify High Income ETF (NYSEARCA:YYY) in February 2021, its share price is down -27% and its total return is +9% (before tax on distributions), while the S&P 500 index has gained 42%. Although YYY has performed decently in the last 10 months, this article renews my long-term negative opinion in the light of updated data.
YYY strategy
Amplify High Income ETF (YYY) is a high-yield fund that launched on 6/21/2013 tracking the ISE High Income Index. It has a portfolio of 60 closed-end funds (CEFs), a distribution rate of 11.85% and a 30-day SEC yield of 10.45%. The expense ratio is extremely high, even compared with other funds of funds: 0.50% in management fees plus 4.10% in held fund expenses, totaling 4.60%! You must see it to believe it:
YYY fees on 9/6/24 (Amplify ETFs website)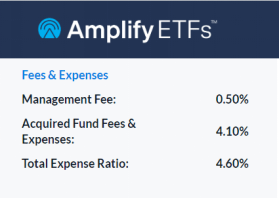
As described by Amplify ETFs, the underlying index:
selects CEFs ranked highest overall by ISE in the following factors: Yield, Discount to Net Asset Value (NAV), and Liquidity. This investment approach results in a portfolio which contains a variety of asset classes, investment strategies and asset managers.
Eligible funds must be listed in the U.S., have a capitalization of at least $500 million and an average daily trading volume of at least $1 million. They are ranked based on a score including 3 factors: yield, discount to NAV and liquidity. Constituents are selected and weighted based on their score, with some adjustments. The index is reconstituted twice a year, in January and July.
The fund changed names in 2019, keeping the same ticker and methodology. The methodology changed in July 2021: the number of holdings increased from 30 to 45, the constituent weight was capped at 3%, and the reconstitution became semi-annual (previously annual). It seems there was another modification in 2024, resulting in an inconsistency on Amplify ETFs website as of 9/6/2024: it reports a list of 60 holdings, while the index methodology document still claims that “the Index seeks to have 45 components, that number should be considered a maximum limit”. I don't like funds that change their methodologies: it may be a clue of failing strategy.
Portfolio
BlackRock is the heaviest fund sponsor in the portfolio (23% of asset value), followed by abrdn (15%) and Nuveen (14%). As of writing, YYY is diversified across asset classes: 59% of asset value is in bonds and 41% in stocks. These numbers may change over time. The heaviest subclass is senior loans, with 16% of assets. The top 10 holdings, listed in the next table, represent 32.2% of asset value, and the heaviest position weighs 3.92%. Therefore, the portfolio is well-diversified and risks related to individual funds are low to moderate.
TICKER | NAME | WEIGHT |
IGR | CBRE Global Real Estate Income Fund | 3.92% |
JQC | Nuveen Credit Strategies Income Fund | 3.28% |
WDI | 3.27% | |
MEGI | NYLI CBRE Global Infrastructure Megatrends Term Fund | 3.23% |
JFR | Nuveen Floating Rate Income Fund/Closed-end Fund | 3.17% |
FAX | 3.14% | |
HQH | abrdn Healthcare Investors | 3.10% |
BCAT | BlackRock Capital Allocation Term Trust | 3.06% |
ECAT | BlackRock ESG Capital Allocation Term Trust | 3.03% |
BMEZ | BlackRock Health Sciences Term Trust | 2.97% |
Closed-end funds are often chosen by investors for their high yields. They also have a few metrics that are not applicable to stocks and ETFs. Two of them are more important than the yield:
- Discount to NAV (higher is better);
- Relative discount = Discount to NAV minus its 12-month average (higher is better).
The latter is meaningful because the discount often shows a mean-reversion pattern. The next table compares these metrics in the full CEF universe and a sample of 37 holdings of YYY (excluding those for which my data provider doesn’t have all the information).
Aggregate discount % | Aggregate relative discount % | |
YYY Holdings (37) | 5.30 | -2.77 |
CEF universe | 6.18 | -2.39 |
Calculation with Portfolio123
This sample of holdings is a bit inferior to the CEF universe regarding these valuation metrics, so YYY valuation is likely slightly below-par.
Past performance
Since 7/1/2013, YYY has underperformed its largest competitor, Invesco CEF Income Composite ETF (PCEF). The next table also includes a benchmark of mine: a simulated portfolio of the 100 CEFs with higher yields among those with an average daily trading volume above $100,000 and a positive discount. It is reconstituted twice a year in equal weight to make it comparable to the underlying index.
Since 7/1/2013 | Total Return | Annual Return | Drawdown | Sharpe ratio | Volatility |
YYY | 58.58% | 4.21% | -42.52% | 0.26 | 13.92% |
PCEF | 90.08% | 5.91% | -38.64% | 0.42 | 12.51% |
My Benchmark | 123.91% | 7.47% | -42.88% | 0.46 | 15.03% |
Data calculated with Portfolio123
YYY underperforms in total return, and also in risk-adjusted performance (Sharpe ratio). However, it is marginally ahead of PCEF over the last 12 months:
YYY vs PCEF, 12-month total return (Seeking Alpha)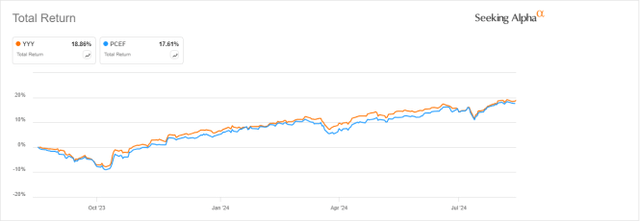
The annualized return, including distributions, is below the distribution rate’s historical average (which is over 8%). It means YYY paid high yields while it was suffering a decay in value. The next chart confirms it: the share price has lost 46% since 7/1/2013. Adding to the pain, the cumulative inflation in the same time was over 30%, based on CPI data. PCEF was a bit better at preserving capital, although a 20% loss isn’t pretty either.
YYY share price history (Seeking Alpha)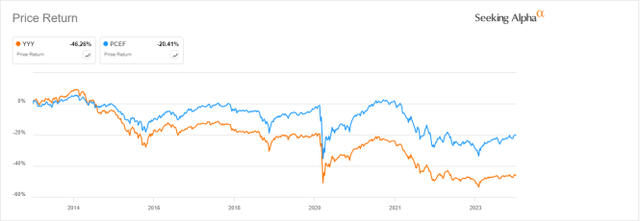
The distribution history isn’t more attractive. The annual sum of distributions decreased from $2.06 per share in 2014 to $1.44 in 2023. For shareholders, it’s a 30% loss of income stream in 9 years, while the cumulative inflation was about 30%.
YYY distribution history (Seeking Alpha)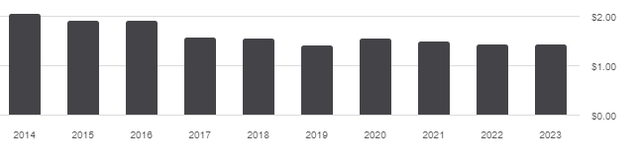
Takeaway
Amplify High Income ETF may be used in short-term trades to profit by some market anomalies. However, it has been a bad long-term investment since its inception in 2013, showing a significant decay in value and distribution. It is unlikely to suddenly become a winner. Anyway, its ridiculous expense ratio of 4.60% is sufficient reason to avoid it.
免责声明:投资有风险,本文并非投资建议,以上内容不应被视为任何金融产品的购买或出售要约、建议或邀请,作者或其他用户的任何相关讨论、评论或帖子也不应被视为此类内容。本文仅供一般参考,不考虑您的个人投资目标、财务状况或需求。TTM对信息的准确性和完整性不承担任何责任或保证,投资者应自行研究并在投资前寻求专业建议。
热议股票
- 1
- 2
- 3
- 4
- 5
- 6
- 7
- 8
- 9
- 10