FTHI: Low Volatility, Not Great Track Record
Olena_T
As the recent equity market selloff has likely eroded a material portion of gains year-to-date, investors may be considering alternatives that can deliver juicy distributions with limited volatility. This is the case of covered call ETFs, like the First Trust BuyWrite Income ETF (NASDAQ:FTHI), which writes calls against a portion of its portfolio as a core strategy in order to generate premiums that are distributed monthly to shareholders.
FTHI's allocation bias toward more defensive areas resulted in a portfolio with relatively low valuations. Furthermore, monthly premiums helped reduce volatility compared to the S&P 500 index. Despite these arguably positive factors, its long-term performance has lagged behind the S&P 500 index, as covered call strategies tend to cap gains from the long portion of the portfolio. This positions FTHI as an income-oriented fund, which is accretive in a diversified portfolio, but not a compelling alternative for broader equity market exposure.
ETF Description & Highlights
FTHI is an exchange-traded fund with a primary objective of generating income and, to a lesser extent, capital appreciation for shareholders. The fund invests in U.S. equities, which are selected through an optimization process that favors stocks that usually pay above-average dividends.
The fund also engages in options strategies aiming at generating extra income that is distributed on a monthly basis. This is generally implemented by writing call options or, in some circumstances, call spreads on the S&P 500 index, seeking extra income from premiums on the options sold. The call options written by the fund comprise a portfolio with expirations of less than one year, with at-the-money to slightly out-of-money strike prices. The notional value of calls written typically ranges between 25% and 75% of the total portfolio.
As of September 4, 2024, FTHI had $845 million in AUM, invested in 169 companies, with an average market cap of $166.8 billion in relatively well-diversified allocation, with 46.4% of total holdings in mega caps, 22.9% in large caps, 10.9% in mid caps, 16.7% in small caps and 2.3% in micro caps. This contrasts with the S&P 500 index, represented in this analysis by the SPDR S&P 500 ETF (SPY), where small and micro caps account for only 0.5% of the index, given its market cap-weighting composition.
FTHI's top ten holdings are Microsoft (6.7%), Apple (5.9%), NVIDIA (5.1%), Amazon (3.5%), Meta Platforms (2.4%), Alphabet Class A (2.1%), Berkshire Hathaway (1.9%), Alphabet Class C (1.8%), Blackstone Mortgage Trust (1.7%), and Eli Lilly (1.6%). Together, they represent 33% of total assets, closely mirroring the S&P 500 index's top holdings, except for the real estate finance Blackstone Mortgage Trust.
Morningstar and First Trust websites, consolidated by the author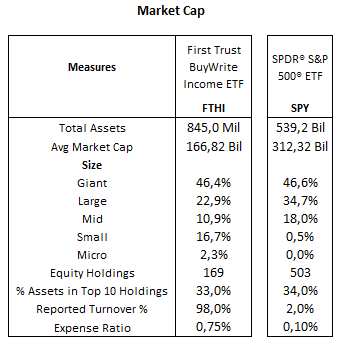
Below is a table comparing FTHI to a peer group of ETFs using covered call strategies that have been around for some time. In this list, XYLD and PBP follow the Cboe S&P 500 BuyWrite Index, mirroring the S&P 500 index's allocation with a fully covered call overwrite. KNG and DIVO skew toward dividend stocks, with tactical option call writing. JEPI, the largest in the group, holds a selected portfolio of stocks and sell calls of the S&P 500 index. At last, QYLG selects stocks within the Nasdaq 100 index, with a 50% covered call overwrite on the same index. As we can see, FTHI sits in the middle of the pack, with nearly 70% of the portfolio overwritten by options. These covered call strategies have produced an average 12-month distribution yield of roughly 8% for the peer group, similar to FTHI. Of these, funds with tactical writing strategies yield below 7%, and funds with 100% option overwriting have distributed nearly 9% over the trailing twelve months.
Two notable characteristics of these funds are the relatively high expense ratios, with FTHI at 0.75% while most peers are also above 0.50%, and high portfolio turnover in funds like KNG, JEPI, and FTHI, likely influenced by monthly call options rollovers.
Source: Morningstar and funds websites, consolidated by the author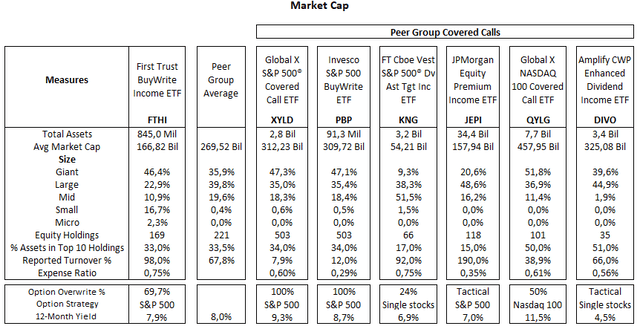
From a sector allocation perspective, FTHI's largest allocation is to the Technology sector, with 25.6% of total equities, followed by Financial Services with 12.5%, Healthcare with 11.9%, Consumer Staples with 11.8%, Consumer Discretionary with 9.5%, Communication Services with 7.9%, Real Estate with 7.4%, Industrials with 4.5%, Energy with 4.0%, Utilities with 3.1%, and Basic Materials with 1.7%.
Relative to the S&P 500, FTHI is primarily overweight in Consumer Staples (+5.6%) and Real Estate (+5.0%), reflecting higher allocations across several segments, particularly in the tobacco industry and REITs. In contrast, FTHI is underweight in Technology (-6.1%) and Industrials (-3.0%), as the fund has lower allocation in Apple and Nvidia and a selective stock picking across semiconductors and software companies as well as in the Industrials sector in general. Compared to other covered call ETFs, FTHI is also overweight in Real Estate and underweight in Industrials, but with similar exposure in other sectors, as the group, on average, seems to adopt a more cautious approach toward high-growth, volatile Technology sector, favoring more defensive areas like Consumer Staples.
Morningstar, consolidated by the author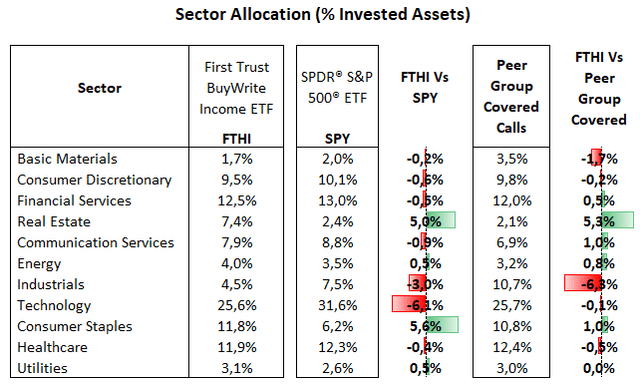
Low Valuations On A Relative Basis
FTHI's underweight allocation to some mega caps trading at high price/earnings ratios like Apple (33.0x), Nvidia (36.2x ), Tesla (88.8x), and Intel (73.0x) has brought its average price/earnings ratio to 20.3x, a discount of nearly 11% compared to the S&P 500 index. This overshadows the negative effect of FTHI's underweight positions in low multiple companies like J&J (16.4x), Chevron (12.0x), and Comcast (9.5x). FTHI's valuation is also lower than the covered call ETFs average of 22.7x. Among peers, XYLD and PBP have a price/earnings ratio of 22.8x, as they track the S&P 500 index, while KNG (20.7x) and DIVO (19.0x) have a value bias, and QYLG (27.9x) has a heavier weighting in the Technology sector with 51% of the portfolio.
Meanwhile, despite the lower valuation, FTHI profitability measures, such as EBITDA margin, are on par with the S&P 500 index, both at nearly 20%, as the negative effect of underweighting companies like Nvidia (62%) and Apple (34%) is offset by overweight positions in names like Visa (70%), American Tower (62%), Altria (60%), and CME Group (62%).
Morningstar, consolidated by the author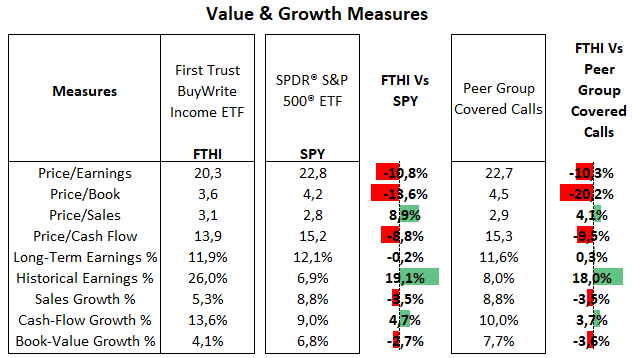
Underperforming The S&P 500 Index But With Lower Volatility
Covered call ETFs have consistently underperformed the S&P 500 index over the past ten years, particularly in bull years and volatile periods like 2020 during the pandemic. The exception was in 2022, when covered call ETFs, by and large, managed to log relatively modest losses amid a steep S&P 500 selloff. Meanwhile, FTHI has returned above the peer group since 2022, after several years of underperformance, with covered call ETFs delivering contrasting results over time, as KNG, JEPI, and DIVO have led the pack, likely driven by their more flexible option writing strategies, while XYLD and PBP have trailed the whole group.
On a positive note, FTHI and other covered call ETFs have been much less volatile over time, with beta at near 0.70, a level close to defensive sectors like Healthcare. This is consistent with FTHI's somewhat defensive portfolio and the nature of the coverall call strategy, where monthly premiums have contributed to total returns stability over time.
Morningstar, consolidated by the author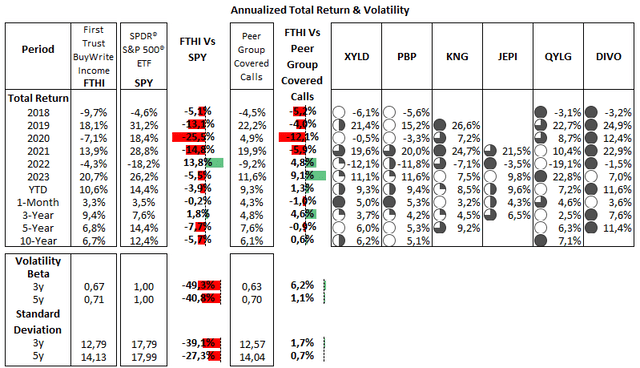
In this context, during bullish markets, as we have experienced most of the time in the past decade or so, covered call strategies tend to be not as competitive compared to long-only strategies, as much of the upside is missed, particularly when writing short-dated options.
On the other hand, my view is that despite a cautious outlook in terms of economic growth in the short term, assuming the U.S. economy will continue to do well in the long run, corporate earnings should grow as well, offering additional upside to the equity market in the years ahead.
In conclusion, while funds like FTHI that employ flexible writing strategies are expected to be more attractive than funds using fully covered portfolios such as XYLD and PBP, I still regard FTHI primarily as an income element in a diversified portfolio. That said, given its somewhat limited upside for an equity portfolio, I take a neutral stance on this fund.
免责声明:投资有风险,本文并非投资建议,以上内容不应被视为任何金融产品的购买或出售要约、建议或邀请,作者或其他用户的任何相关讨论、评论或帖子也不应被视为此类内容。本文仅供一般参考,不考虑您的个人投资目标、财务状况或需求。TTM对信息的准确性和完整性不承担任何责任或保证,投资者应自行研究并在投资前寻求专业建议。
热议股票
- 1
- 2
- 3
- 4
- 5
- 6
- 7
- 8
- 9
- 10