Airgain, Inc. (NASDAQ:AIRG) surges 12%; retail investors who own 48% shares profited along with institutions
Key Insights
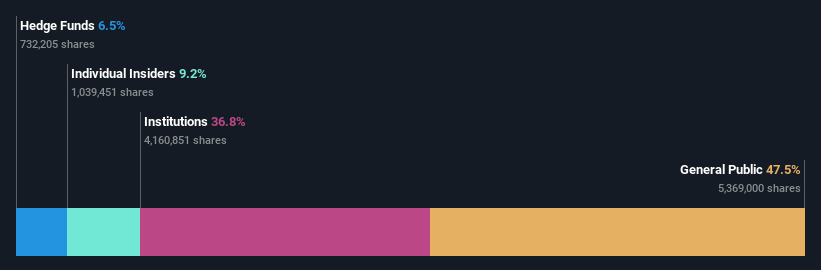
- Significant control over Airgain by retail investors implies that the general public has more power to influence management and governance-related decisions
- The top 22 shareholders own 50% of the company
- Institutions own 37% of Airgain
A look at the shareholders of Airgain, Inc. (NASDAQ:AIRG) can tell us which group is most powerful. And the group that holds the biggest piece of the pie are retail investors with 48% ownership. In other words, the group stands to gain the most (or lose the most) from their investment into the company.
While retail investors were the group that reaped the most benefits after last week’s 12% price gain, institutions also received a 37% cut.
Let's delve deeper into each type of owner of Airgain, beginning with the chart below.
View our latest analysis for Airgain
What Does The Institutional Ownership Tell Us About Airgain?
Institutions typically measure themselves against a benchmark when reporting to their own investors, so they often become more enthusiastic about a stock once it's included in a major index. We would expect most companies to have some institutions on the register, especially if they are growing.
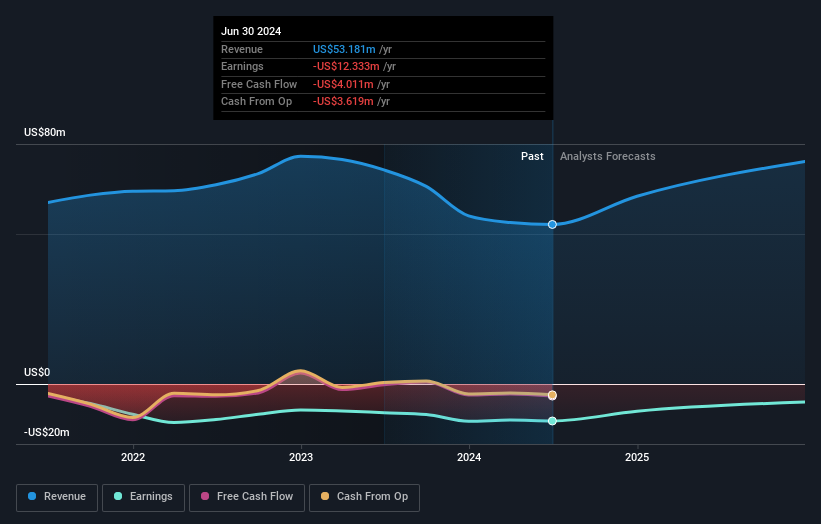
Airgain already has institutions on the share registry. Indeed, they own a respectable stake in the company. This can indicate that the company has a certain degree of credibility in the investment community. However, it is best to be wary of relying on the supposed validation that comes with institutional investors. They too, get it wrong sometimes. When multiple institutions own a stock, there's always a risk that they are in a 'crowded trade'. When such a trade goes wrong, multiple parties may compete to sell stock fast. This risk is higher in a company without a history of growth. You can see Airgain's historic earnings and revenue below, but keep in mind there's always more to the story.
It would appear that 6.5% of Airgain shares are controlled by hedge funds. That catches my attention because hedge funds sometimes try to influence management, or bring about changes that will create near term value for shareholders. William Blair Investment Management, LLC is currently the largest shareholder, with 7.2% of shares outstanding. With 6.5% and 5.8% of the shares outstanding respectively, Marathon Micro Partners, LLC and Columbia Management Investment Advisers, LLC are the second and third largest shareholders. Additionally, the company's CEO Jacob Suen directly holds 0.8% of the total shares outstanding.
A closer look at our ownership figures suggests that the top 22 shareholders have a combined ownership of 50% implying that no single shareholder has a majority.
Researching institutional ownership is a good way to gauge and filter a stock's expected performance. The same can be achieved by studying analyst sentiments. There are a reasonable number of analysts covering the stock, so it might be useful to find out their aggregate view on the future.
Insider Ownership Of Airgain
While the precise definition of an insider can be subjective, almost everyone considers board members to be insiders. Management ultimately answers to the board. However, it is not uncommon for managers to be executive board members, especially if they are a founder or the CEO.
Insider ownership is positive when it signals leadership are thinking like the true owners of the company. However, high insider ownership can also give immense power to a small group within the company. This can be negative in some circumstances.
Shareholders would probably be interested to learn that insiders own shares in Airgain, Inc.. In their own names, insiders own US$10m worth of stock in the US$113m company. This shows at least some alignment, but we usually like to see larger insider holdings. You can click here to see if those insiders have been buying or selling.
General Public Ownership
The general public, who are usually individual investors, hold a 48% stake in Airgain. This size of ownership, while considerable, may not be enough to change company policy if the decision is not in sync with other large shareholders.
Next Steps:
While it is well worth considering the different groups that own a company, there are other factors that are even more important. To that end, you should learn about the 3 warning signs we've spotted with Airgain (including 1 which can't be ignored) .
Ultimately the future is most important. You can access this free report on analyst forecasts for the company.
NB: Figures in this article are calculated using data from the last twelve months, which refer to the 12-month period ending on the last date of the month the financial statement is dated. This may not be consistent with full year annual report figures.
New: Manage All Your Stock Portfolios in One Place
We've created the ultimate portfolio companion for stock investors, and it's free.
• Connect an unlimited number of Portfolios and see your total in one currency• Be alerted to new Warning Signs or Risks via email or mobile• Track the Fair Value of your stocks
Try a Demo Portfolio for FreeHave feedback on this article? Concerned about the content? Get in touch with us directly. Alternatively, email editorial-team (at) simplywallst.com.This article by Simply Wall St is general in nature. We provide commentary based on historical data and analyst forecasts only using an unbiased methodology and our articles are not intended to be financial advice. It does not constitute a recommendation to buy or sell any stock, and does not take account of your objectives, or your financial situation. We aim to bring you long-term focused analysis driven by fundamental data. Note that our analysis may not factor in the latest price-sensitive company announcements or qualitative material. Simply Wall St has no position in any stocks mentioned.
免责声明:投资有风险,本文并非投资建议,以上内容不应被视为任何金融产品的购买或出售要约、建议或邀请,作者或其他用户的任何相关讨论、评论或帖子也不应被视为此类内容。本文仅供一般参考,不考虑您的个人投资目标、财务状况或需求。TTM对信息的准确性和完整性不承担任何责任或保证,投资者应自行研究并在投资前寻求专业建议。
热议股票
- 1
- 2
- 3
- 4
- 5
- 6
- 7
- 8
- 9
- 10