Ethereum (ETH) Price Regains Footing After $3,000 Scare — What Lies Ahead
- Ethereum's 30-day MVRV ratio remains at a point far below potential market top, suggesting more upside.
- Previously dormant coins are also involved in transactions, reinforcing the bullish thesis around Ethereum.
- Analysis shows that ETH could rally toward $4,000, but could decline to $3,000 if selling pressure increases.
Recently, Ethereum (ETH) showed signs of falling below $3,000 but held firm as bulls defended the altcoin.
Now trading at $3,480, here’s what could be next for ETH.
Ethereum Still Has More Room to Grow
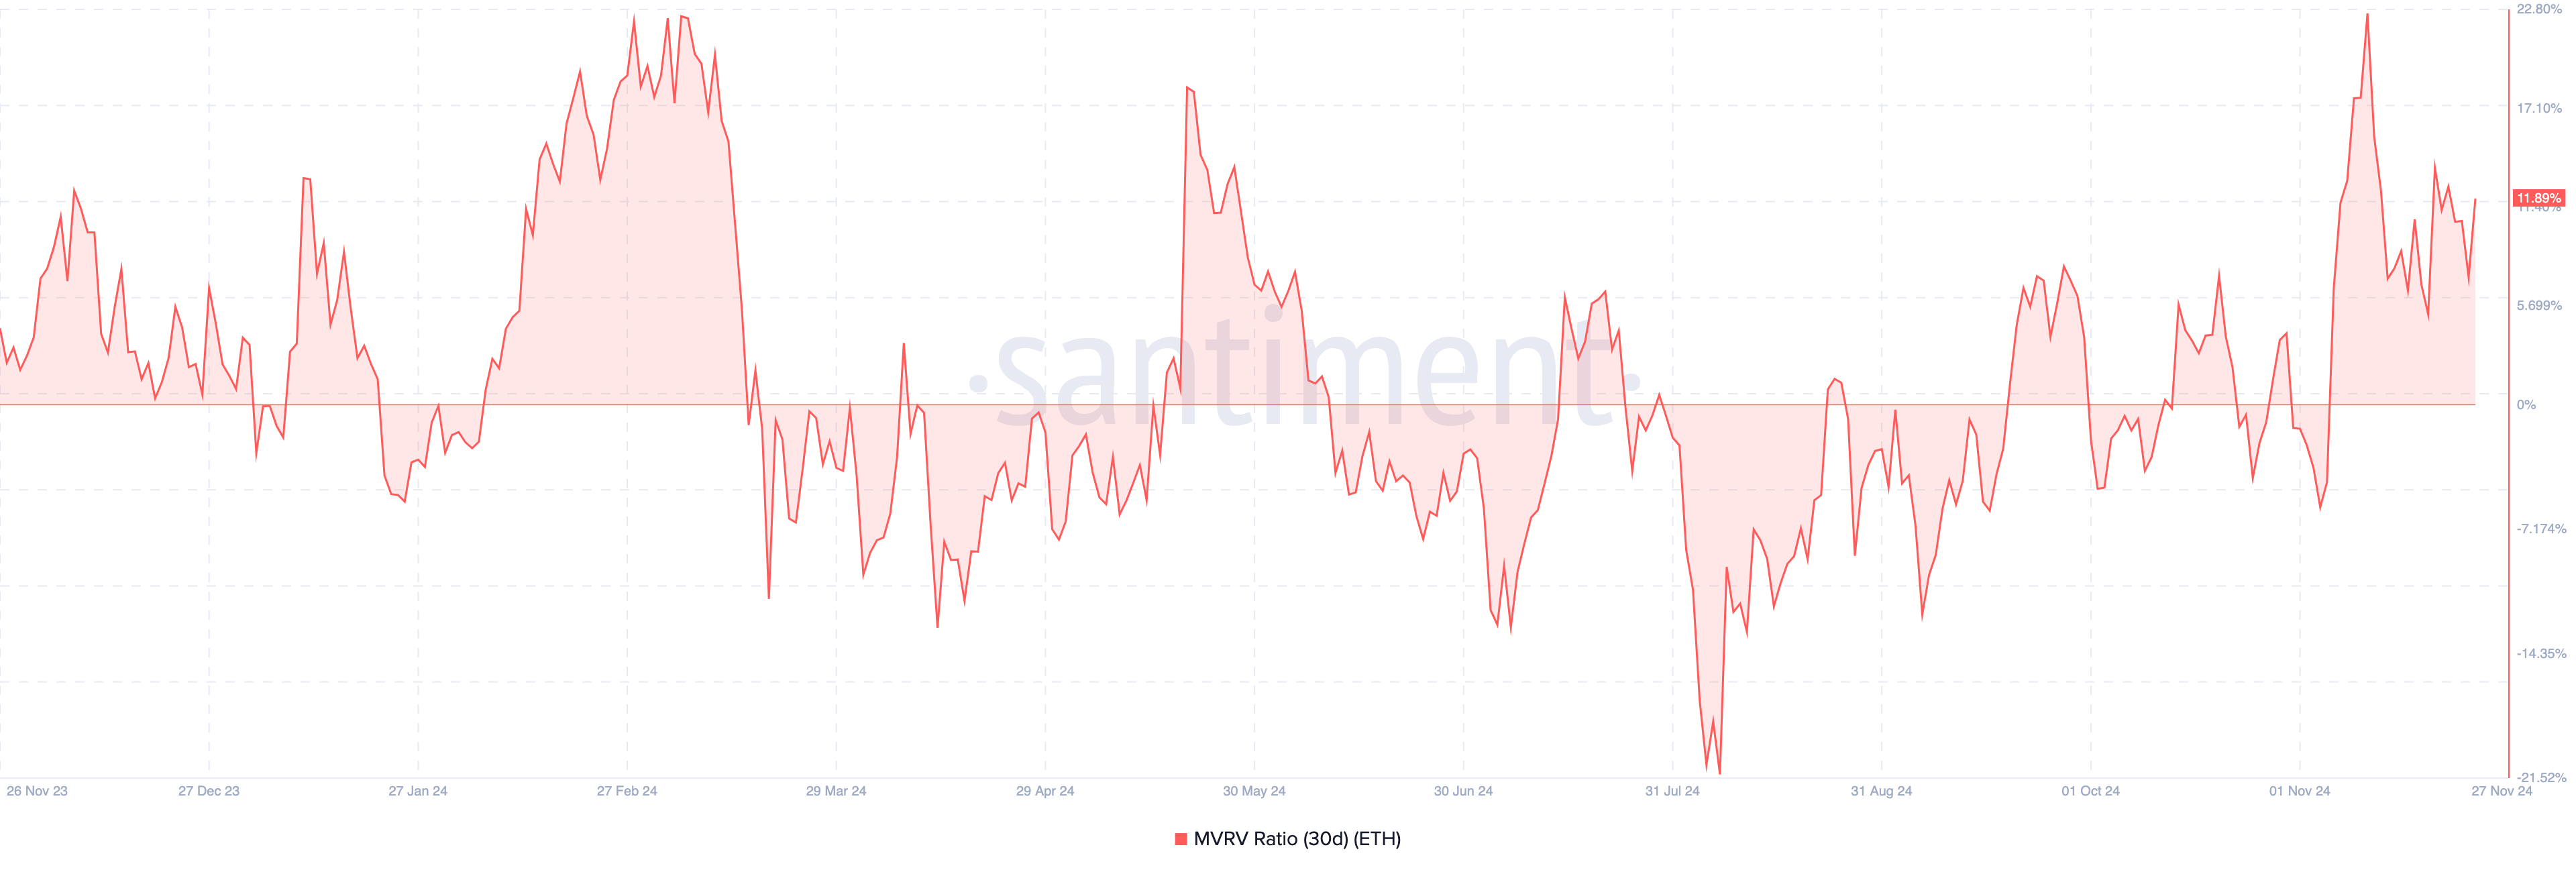
One metric that has consistently proven reliable for analyzing Ethereum is the Market Value to Realized Value (MVRV) ratio, a tool for assessing the profitability of holders and identifying potential market tops or bottoms. The MVRV ratio compares a cryptocurrency’s market value to its realized value, offering insights into whether the asset is overvalued or undervalued.
When the MVRV ratio rises, it indicates that more holders are in profit. However, if it climbs to an extreme high, it suggests the asset may be overvalued, increasing the risk of a price correction. Conversely, when the MVRV ratio declines, it points to reduced profitability.
If the ratio hits an extreme low, it signals undervaluation, which can present an attractive accumulation opportunity for investors. For ETH, the 30-day MVRV ratio has risen to 11.89%. However, this ratio is not close to the local top, which is usually around 18% and 22%. Therefore, this development suggests that Ethereum’s price.
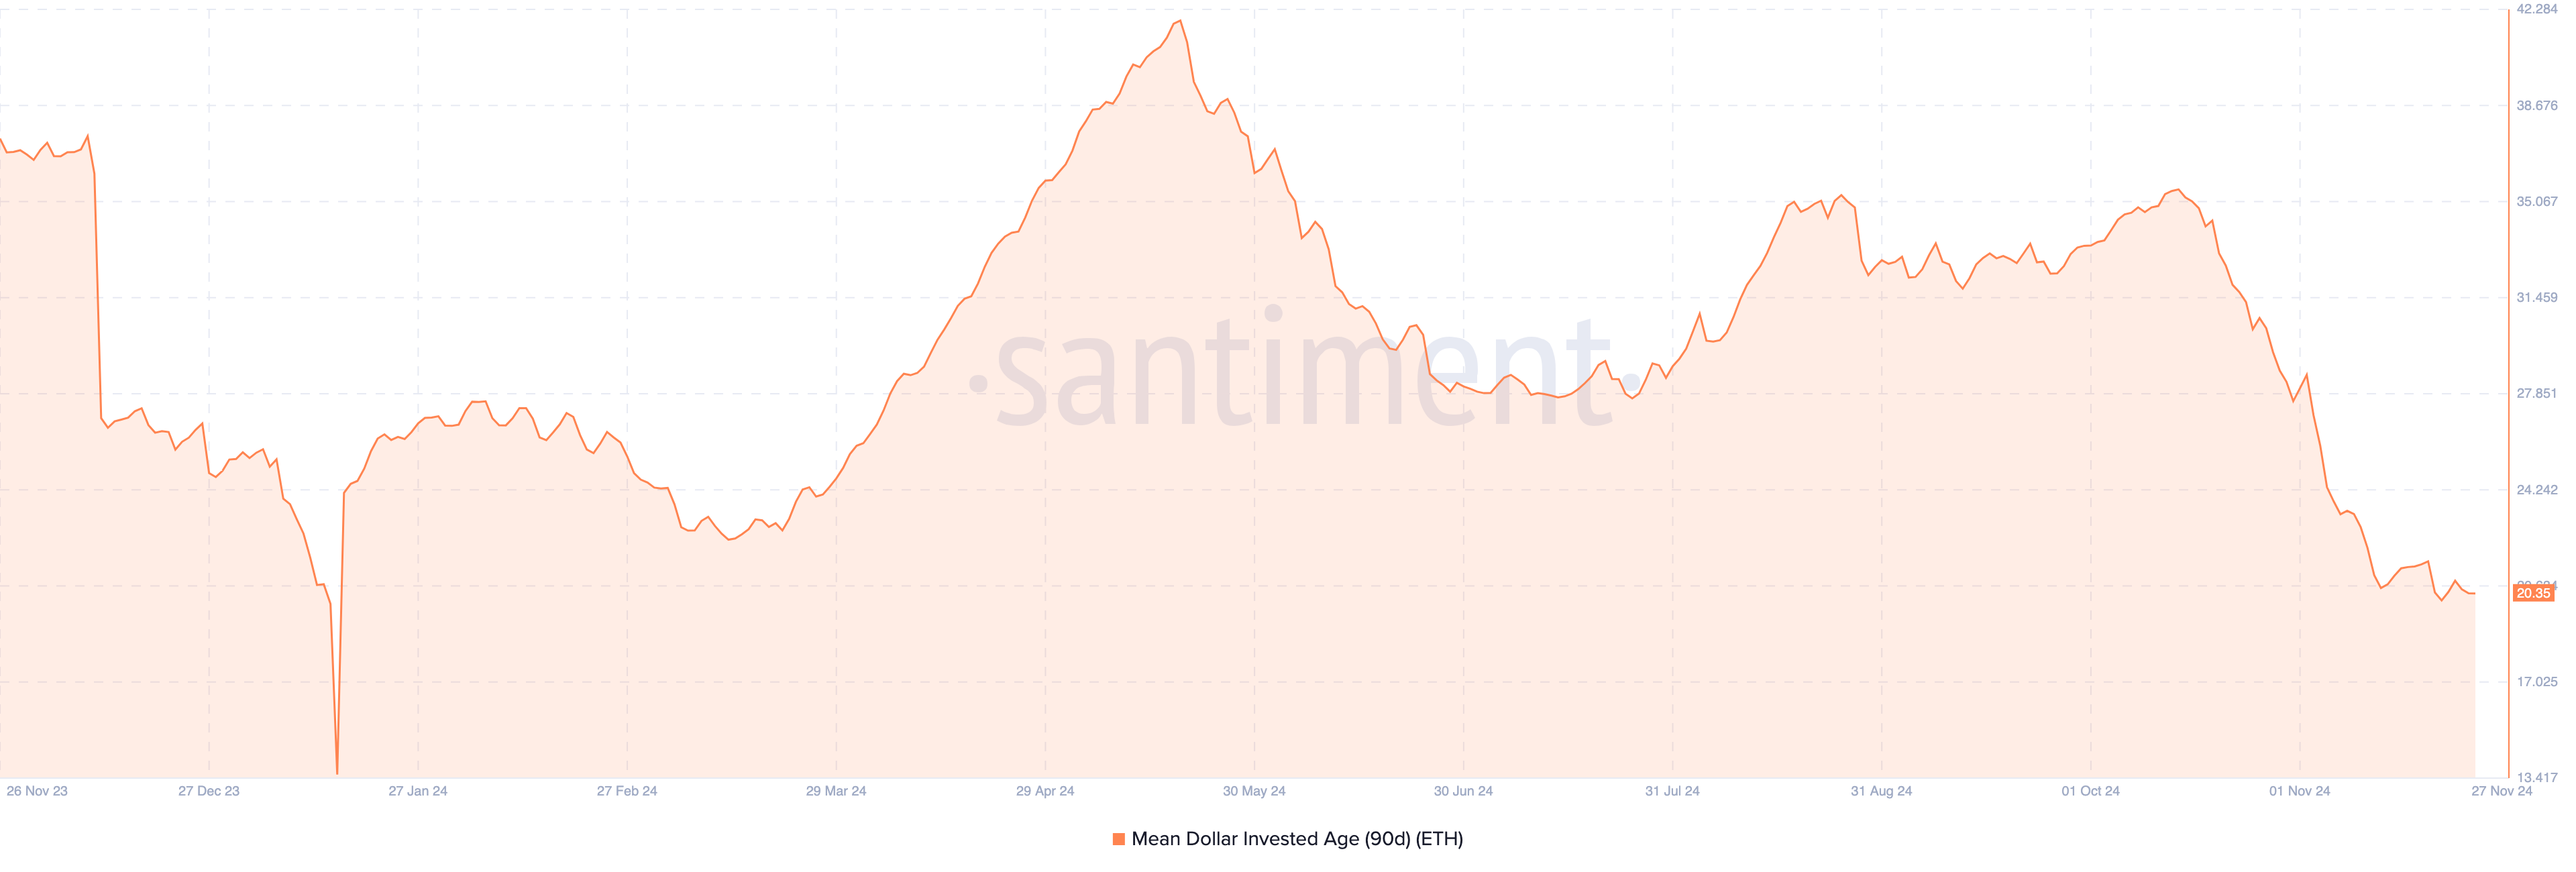
Beyond the MVRV ratio, the Mean Dollar Invested Age (MDIA) also suggests that Ethereum may avoid a further price drop. MDIA measures the average age of all coins on a blockchain, weighted by their purchase price.
A rising MDIA indicates that coins are becoming more stagnant, reducing the likelihood of a significant price surge.
Conversely, a declining MDIA suggests that previously dormant coins are moving, signaling increased trading activity, which is the case with ETH. If this trend persists, it could boost Ethereum’s chances of a price rally.
ETH Price Prediction: $4,000 Could Be Coming
On the daily chart, Ethereum’s price has formed an inverse head-and-shoulders pattern. This pattern typically emerges after a prolonged downtrend, signaling a potential sellers’ exhaustion point.
The pattern comprises three key parts: the left shoulder, which marks the first uptrend; the head, signaling the end of the downtrend; and the right shoulder, indicating the rebound.
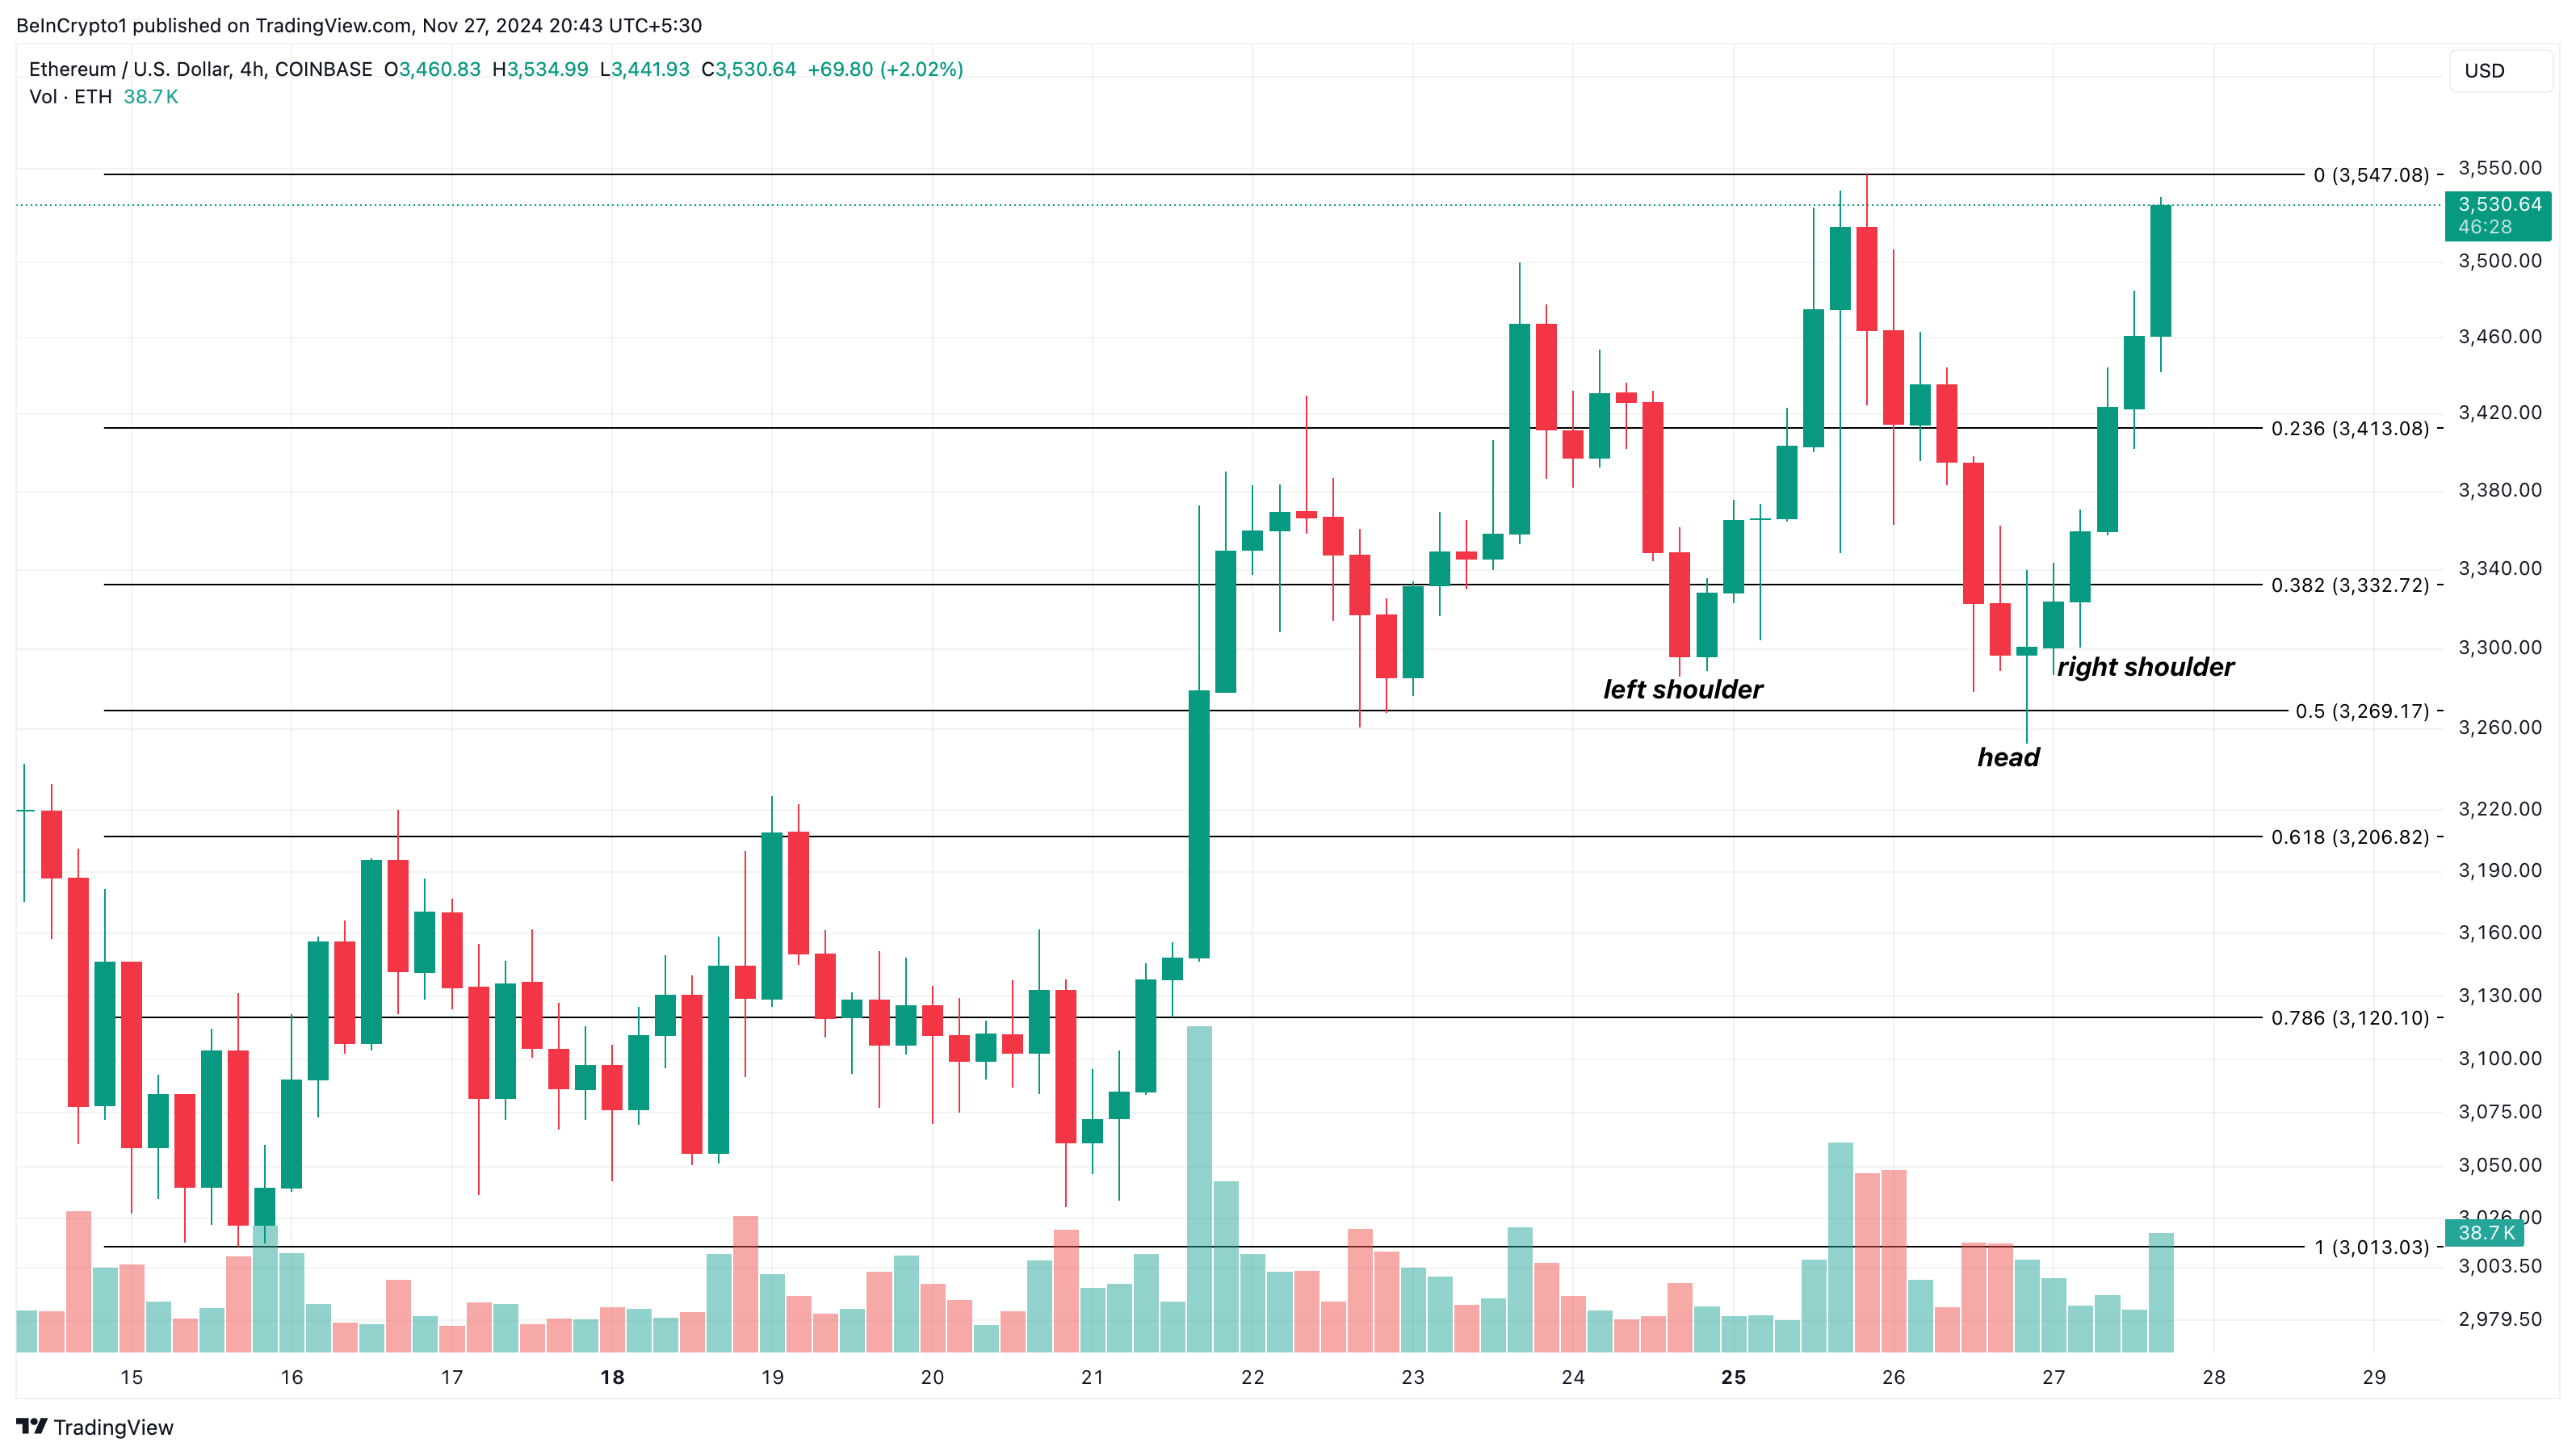
With ETH trending in an uptrend, the cryptocurrency is likely to rise toward $4,000 in the short term. On the other hand, if selling pressure rises, this might change, and ETH could decline to $3,206.
免责声明:投资有风险,本文并非投资建议,以上内容不应被视为任何金融产品的购买或出售要约、建议或邀请,作者或其他用户的任何相关讨论、评论或帖子也不应被视为此类内容。本文仅供一般参考,不考虑您的个人投资目标、财务状况或需求。TTM对信息的准确性和完整性不承担任何责任或保证,投资者应自行研究并在投资前寻求专业建议。
热议股票
- 1
- 2
- 3
- 4
- 5
- 6
- 7
- 8
- 9
- 10