Jenscare Scientific And 2 Other Promising Penny Stocks For Your Watchlist
As global markets experience a divergence in performance, with major indexes like the S&P 500 and Nasdaq hitting record highs while others falter, investors are exploring diverse opportunities. In such a landscape, penny stocks—often representing smaller or newer companies—offer an intriguing blend of affordability and potential growth. Despite being considered somewhat outdated as a term, these stocks remain relevant for those looking to capitalize on under-the-radar companies with strong financials.
Top 10 Penny Stocks
| Name | Share Price | Market Cap | Financial Health Rating |
| DXN Holdings Bhd (KLSE:DXN) | MYR0.51 | MYR2.56B | ★★★★★★ |
| Tristel (AIM:TSTL) | £3.65 | £174.08M | ★★★★★★ |
| Embark Early Education (ASX:EVO) | A$0.78 | A$144.03M | ★★★★☆☆ |
| Hil Industries Berhad (KLSE:HIL) | MYR0.90 | MYR298.75M | ★★★★★★ |
| ME Group International (LSE:MEGP) | £2.16 | £813.81M | ★★★★★★ |
| Lever Style (SEHK:1346) | HK$0.87 | HK$552.27M | ★★★★★★ |
| Bosideng International Holdings (SEHK:3998) | HK$4.02 | HK$44.6B | ★★★★★★ |
| LaserBond (ASX:LBL) | A$0.575 | A$65.64M | ★★★★★★ |
| Datasonic Group Berhad (KLSE:DSONIC) | MYR0.425 | MYR1.13B | ★★★★★★ |
| Secure Trust Bank (LSE:STB) | £3.53 | £67.32M | ★★★★☆☆ |
Click here to see the full list of 5,698 stocks from our Penny Stocks screener.
Let's review some notable picks from our screened stocks.
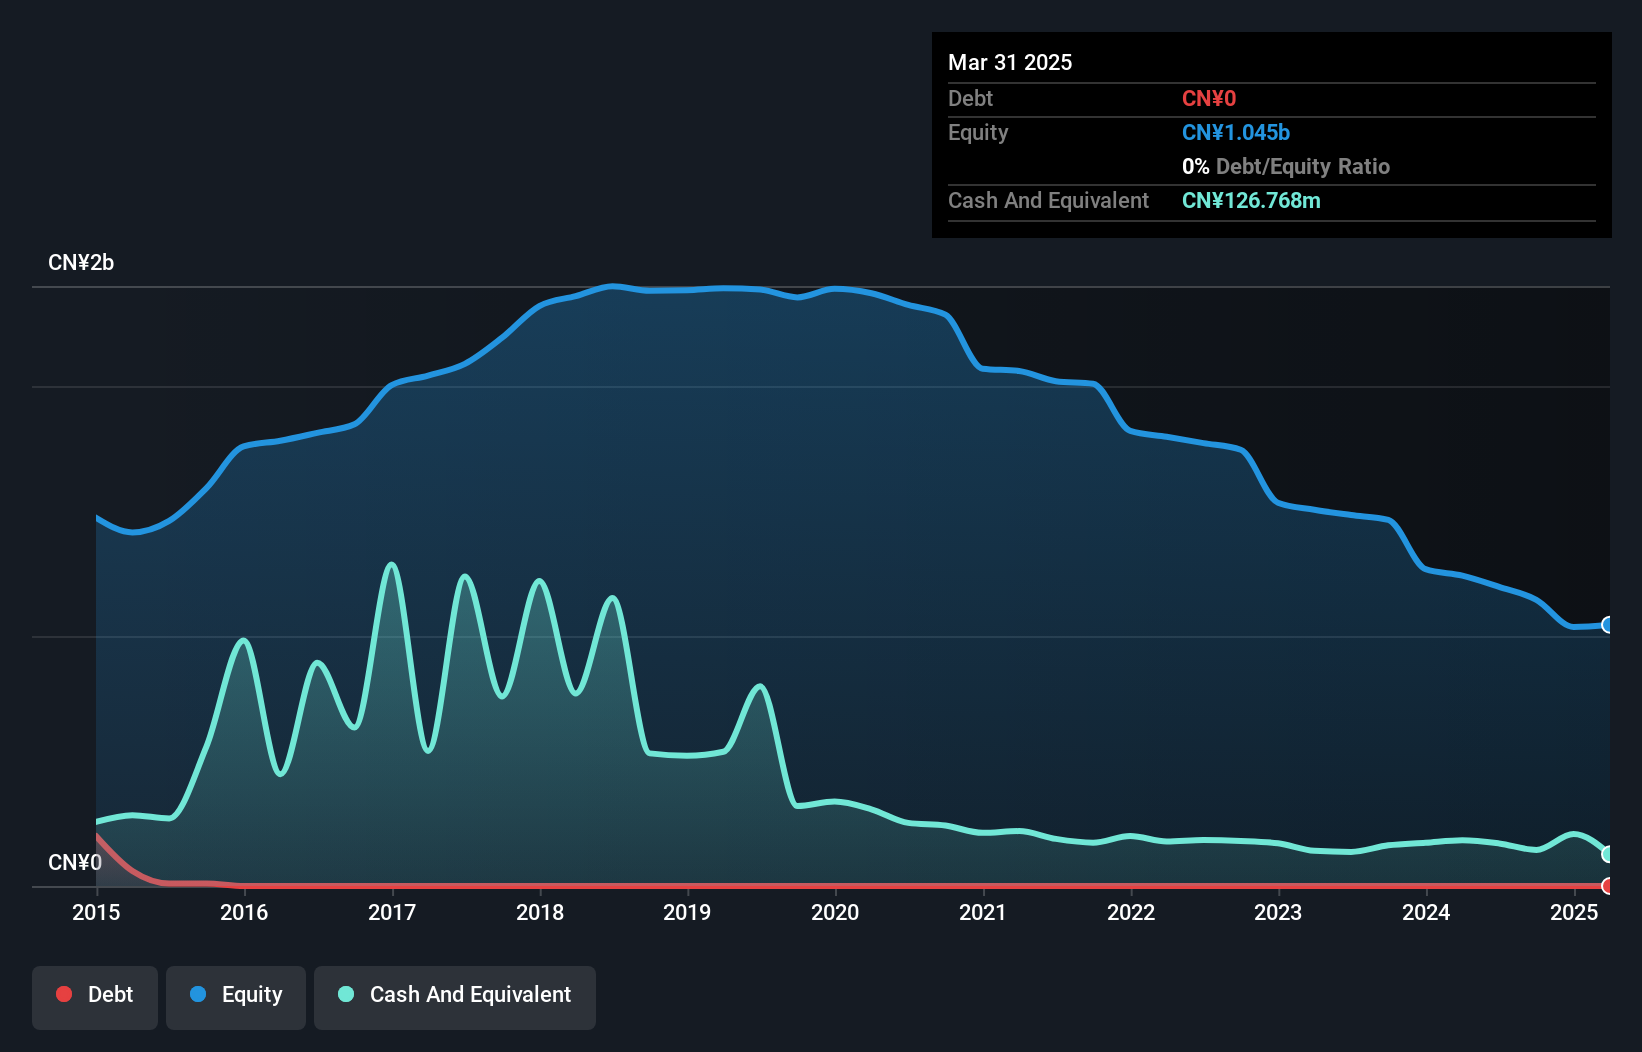
Jenscare Scientific (SEHK:9877)
Simply Wall St Financial Health Rating: ★★★★★☆
Overview: Jenscare Scientific Co., Ltd. is a medical device company focused on developing interventional products for treating structural heart diseases in China, with a market cap of HK$1.27 billion.
Operations: There are no reported revenue segments for this medical device company.
Market Cap: HK$1.27B
Jenscare Scientific, a medical device company with a market cap of HK$1.27 billion, remains pre-revenue and unprofitable but holds potential due to its innovative LuX-Valve Plus system for treating tricuspid regurgitation. The recent TRAVEL II study presented promising results at the TCT 2024 conference, demonstrating safety and efficacy in high-risk patients. Despite financial challenges, Jenscare's cash reserves exceed both short- and long-term liabilities, providing a runway of over two years if current cash flow trends continue. The company's management and board are experienced, supporting its strategic focus on expanding global applications for the LuX-Valve series.
- Get an in-depth perspective on Jenscare Scientific's performance by reading our balance sheet health report here.
- Learn about Jenscare Scientific's future growth trajectory here.

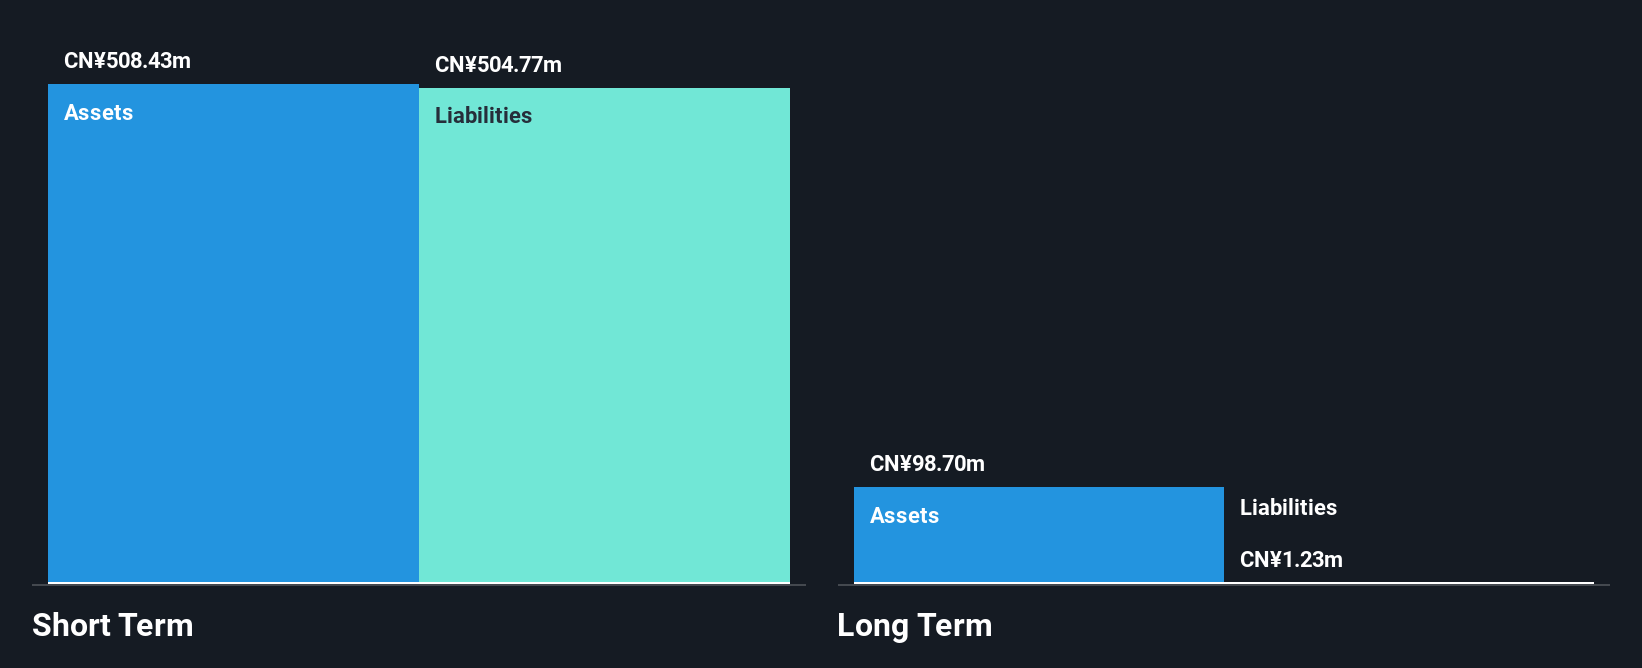
Qinghai Spring Medicinal Resources Technology (SHSE:600381)
Simply Wall St Financial Health Rating: ★★★★★★
Overview: Qinghai Spring Medicinal Resources Technology Co., Ltd. operates in the medicinal resources sector and has a market capitalization of approximately CN¥1.78 billion.
Operations: Qinghai Spring Medicinal Resources Technology Co., Ltd. has not reported any specific revenue segments.
Market Cap: CN¥1.78B
Qinghai Spring Medicinal Resources Technology, with a market cap of CN¥1.78 billion, reported sales of CN¥198.03 million for the first nine months of 2024, up from CN¥160.71 million the previous year, but remains unprofitable with a net loss of CN¥90.45 million. The company is debt-free and its short-term assets significantly exceed both short- and long-term liabilities, indicating solid financial footing despite ongoing losses. Trading at a substantial discount to estimated fair value suggests potential upside if profitability improves; however, earnings have declined over the past five years by 22.4% annually, highlighting operational challenges ahead.
- Take a closer look at Qinghai Spring Medicinal Resources Technology's potential here in our financial health report.
- Assess Qinghai Spring Medicinal Resources Technology's previous results with our detailed historical performance reports.
Shenzhen DivisionLtd (SZSE:300167)
Simply Wall St Financial Health Rating: ★★★★☆☆
Overview: Shenzhen Division Co., Ltd. focuses on the research, development, and sale of smart video and IoT core technology products and solutions mainly in China, with a market cap of CN¥763.12 million.
Operations: The company's revenue is primarily derived from its operations in China, totaling CN¥593.32 million.
Market Cap: CN¥763.12M
Shenzhen Division Co., Ltd. has seen its revenue grow significantly, reporting CN¥327.34 million for the first nine months of 2024, up from CN¥169.96 million a year earlier, though it remains unprofitable with a net loss of CN¥28.89 million. The company maintains a strong cash position with short-term assets exceeding long-term liabilities and more cash than total debt, providing over three years of cash runway even if free cash flow declines by 22.1% annually. Despite trading well below estimated fair value and having stable weekly volatility at 10%, challenges include increased debt levels and negative return on equity due to ongoing losses.
- Click here to discover the nuances of Shenzhen DivisionLtd with our detailed analytical financial health report.
- Examine Shenzhen DivisionLtd's past performance report to understand how it has performed in prior years.
Seize The Opportunity
- Investigate our full lineup of 5,698 Penny Stocks right here.
- Already own these companies? Link your portfolio to Simply Wall St and get alerts on any new warning signs to your stocks.
- Streamline your investment strategy with Simply Wall St's app for free and benefit from extensive research on stocks across all corners of the world.
Contemplating Other Strategies?
- Explore high-performing small cap companies that haven't yet garnered significant analyst attention.
- Jump on the AI train with fast growing tech companies forging a new era of innovation.
- Find companies with promising cash flow potential yet trading below their fair value.
This article by Simply Wall St is general in nature. We provide commentary based on historical data and analyst forecasts only using an unbiased methodology and our articles are not intended to be financial advice. It does not constitute a recommendation to buy or sell any stock, and does not take account of your objectives, or your financial situation. We aim to bring you long-term focused analysis driven by fundamental data. Note that our analysis may not factor in the latest price-sensitive company announcements or qualitative material. Simply Wall St has no position in any stocks mentioned.
New: Manage All Your Stock Portfolios in One Place
We've created the ultimate portfolio companion for stock investors, and it's free.
• Connect an unlimited number of Portfolios and see your total in one currency• Be alerted to new Warning Signs or Risks via email or mobile• Track the Fair Value of your stocks
Try a Demo Portfolio for FreeHave feedback on this article? Concerned about the content? Get in touch with us directly. Alternatively, email editorial-team@simplywallst.com
免责声明:投资有风险,本文并非投资建议,以上内容不应被视为任何金融产品的购买或出售要约、建议或邀请,作者或其他用户的任何相关讨论、评论或帖子也不应被视为此类内容。本文仅供一般参考,不考虑您的个人投资目标、财务状况或需求。TTM对信息的准确性和完整性不承担任何责任或保证,投资者应自行研究并在投资前寻求专业建议。
热议股票
- 1
- 2
- 3
- 4
- 5
- 6
- 7
- 8
- 9
- 10