Here's Why Newton Resources (HKG:1231) Can Manage Its Debt Responsibly
David Iben put it well when he said, 'Volatility is not a risk we care about. What we care about is avoiding the permanent loss of capital.' It's only natural to consider a company's balance sheet when you examine how risky it is, since debt is often involved when a business collapses. We note that Newton Resources Ltd (HKG:1231) does have debt on its balance sheet. But the more important question is: how much risk is that debt creating?
What Risk Does Debt Bring?
Debt assists a business until the business has trouble paying it off, either with new capital or with free cash flow. Ultimately, if the company can't fulfill its legal obligations to repay debt, shareholders could walk away with nothing. However, a more usual (but still expensive) situation is where a company must dilute shareholders at a cheap share price simply to get debt under control. By replacing dilution, though, debt can be an extremely good tool for businesses that need capital to invest in growth at high rates of return. When we examine debt levels, we first consider both cash and debt levels, together.
Check out our latest analysis for Newton Resources
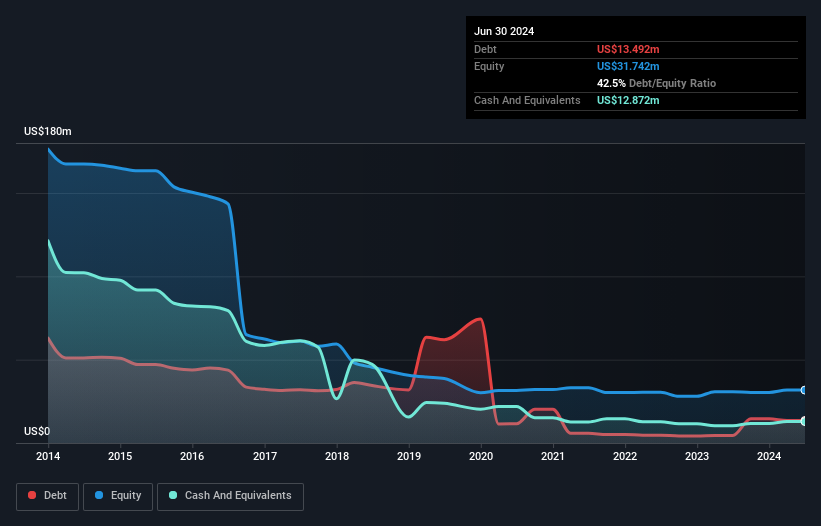
What Is Newton Resources's Net Debt?
The image below, which you can click on for greater detail, shows that at June 2024 Newton Resources had debt of US$13.5m, up from US$4.43m in one year. However, it also had US$12.9m in cash, and so its net debt is US$620.0k.
A Look At Newton Resources' Liabilities
Zooming in on the latest balance sheet data, we can see that Newton Resources had liabilities of US$42.3m due within 12 months and no liabilities due beyond that. Offsetting this, it had US$12.9m in cash and US$31.2m in receivables that were due within 12 months. So it actually has US$1.79m more liquid assets than total liabilities.
Having regard to Newton Resources' size, it seems that its liquid assets are well balanced with its total liabilities. So while it's hard to imagine that the US$149.2m company is struggling for cash, we still think it's worth monitoring its balance sheet. Carrying virtually no net debt, Newton Resources has a very light debt load indeed.
We use two main ratios to inform us about debt levels relative to earnings. The first is net debt divided by earnings before interest, tax, depreciation, and amortization (EBITDA), while the second is how many times its earnings before interest and tax (EBIT) covers its interest expense (or its interest cover, for short). The advantage of this approach is that we take into account both the absolute quantum of debt (with net debt to EBITDA) and the actual interest expenses associated with that debt (with its interest cover ratio).
While Newton Resources's low debt to EBITDA ratio of 0.34 suggests only modest use of debt, the fact that EBIT only covered the interest expense by 6.9 times last year does give us pause. So we'd recommend keeping a close eye on the impact financing costs are having on the business. Even more impressive was the fact that Newton Resources grew its EBIT by 114% over twelve months. If maintained that growth will make the debt even more manageable in the years ahead. The balance sheet is clearly the area to focus on when you are analysing debt. But it is Newton Resources's earnings that will influence how the balance sheet holds up in the future. So if you're keen to discover more about its earnings, it might be worth checking out this graph of its long term earnings trend.
Finally, a business needs free cash flow to pay off debt; accounting profits just don't cut it. So we always check how much of that EBIT is translated into free cash flow. Over the last two years, Newton Resources saw substantial negative free cash flow, in total. While that may be a result of expenditure for growth, it does make the debt far more risky.
Our View
Happily, Newton Resources's impressive EBIT growth rate implies it has the upper hand on its debt. But the stark truth is that we are concerned by its conversion of EBIT to free cash flow. Looking at all the aforementioned factors together, it strikes us that Newton Resources can handle its debt fairly comfortably. Of course, while this leverage can enhance returns on equity, it does bring more risk, so it's worth keeping an eye on this one. There's no doubt that we learn most about debt from the balance sheet. However, not all investment risk resides within the balance sheet - far from it. To that end, you should be aware of the 1 warning sign we've spotted with Newton Resources .
If, after all that, you're more interested in a fast growing company with a rock-solid balance sheet, then check out our list of net cash growth stocks without delay.
Valuation is complex, but we're here to simplify it.
Discover if Newton Resources might be undervalued or overvalued with our detailed analysis, featuring fair value estimates, potential risks, dividends, insider trades, and its financial condition.
Access Free AnalysisHave feedback on this article? Concerned about the content? Get in touch with us directly. Alternatively, email editorial-team (at) simplywallst.com.This article by Simply Wall St is general in nature. We provide commentary based on historical data and analyst forecasts only using an unbiased methodology and our articles are not intended to be financial advice. It does not constitute a recommendation to buy or sell any stock, and does not take account of your objectives, or your financial situation. We aim to bring you long-term focused analysis driven by fundamental data. Note that our analysis may not factor in the latest price-sensitive company announcements or qualitative material. Simply Wall St has no position in any stocks mentioned.
免责声明:投资有风险,本文并非投资建议,以上内容不应被视为任何金融产品的购买或出售要约、建议或邀请,作者或其他用户的任何相关讨论、评论或帖子也不应被视为此类内容。本文仅供一般参考,不考虑您的个人投资目标、财务状况或需求。TTM对信息的准确性和完整性不承担任何责任或保证,投资者应自行研究并在投资前寻求专业建议。
热议股票
- 1
- 2
- 3
- 4
- 5
- 6
- 7
- 8
- 9
- 10