CNOOC Limited's (HKG:883) Stock Has Been Sliding But Fundamentals Look Strong: Is The Market Wrong?
CNOOC (HKG:883) has had a rough three months with its share price down 5.7%. However, stock prices are usually driven by a company’s financial performance over the long term, which in this case looks quite promising. In this article, we decided to focus on CNOOC's ROE.
Return on equity or ROE is a key measure used to assess how efficiently a company's management is utilizing the company's capital. In other words, it is a profitability ratio which measures the rate of return on the capital provided by the company's shareholders.
View our latest analysis for CNOOC
How Is ROE Calculated?
Return on equity can be calculated by using the formula:
Return on Equity = Net Profit (from continuing operations) ÷ Shareholders' Equity
So, based on the above formula, the ROE for CNOOC is:
20% = CN¥143b ÷ CN¥721b (Based on the trailing twelve months to September 2024).
The 'return' refers to a company's earnings over the last year. So, this means that for every HK$1 of its shareholder's investments, the company generates a profit of HK$0.20.
What Has ROE Got To Do With Earnings Growth?
So far, we've learned that ROE is a measure of a company's profitability. Based on how much of its profits the company chooses to reinvest or "retain", we are then able to evaluate a company's future ability to generate profits. Assuming everything else remains unchanged, the higher the ROE and profit retention, the higher the growth rate of a company compared to companies that don't necessarily bear these characteristics.
CNOOC's Earnings Growth And 20% ROE
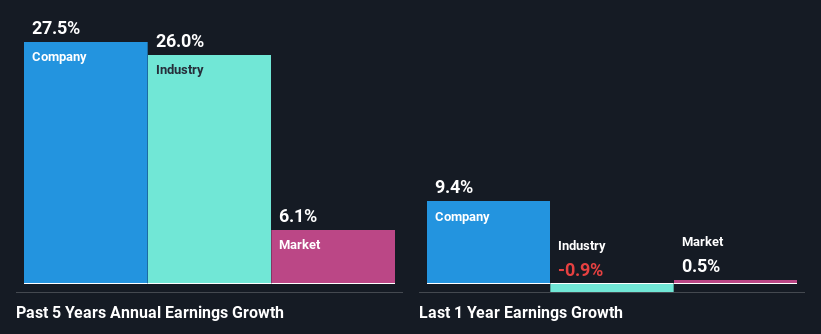
To start with, CNOOC's ROE looks acceptable. Especially when compared to the industry average of 9.9% the company's ROE looks pretty impressive. This certainly adds some context to CNOOC's exceptional 27% net income growth seen over the past five years. We believe that there might also be other aspects that are positively influencing the company's earnings growth. For instance, the company has a low payout ratio or is being managed efficiently.
Next, on comparing CNOOC's net income growth with the industry, we found that the company's reported growth is similar to the industry average growth rate of 26% over the last few years.
Earnings growth is an important metric to consider when valuing a stock. What investors need to determine next is if the expected earnings growth, or the lack of it, is already built into the share price. By doing so, they will have an idea if the stock is headed into clear blue waters or if swampy waters await. Is CNOOC fairly valued compared to other companies? These 3 valuation measures might help you decide.
Is CNOOC Using Its Retained Earnings Effectively?
The three-year median payout ratio for CNOOC is 42%, which is moderately low. The company is retaining the remaining 58%. So it seems that CNOOC is reinvesting efficiently in a way that it sees impressive growth in its earnings (discussed above) and pays a dividend that's well covered.
Moreover, CNOOC is determined to keep sharing its profits with shareholders which we infer from its long history of paying a dividend for at least ten years. Our latest analyst data shows that the future payout ratio of the company over the next three years is expected to be approximately 43%. Regardless, CNOOC's ROE is speculated to decline to 15% despite there being no anticipated change in its payout ratio.
Conclusion
Overall, we are quite pleased with CNOOC's performance. Specifically, we like that the company is reinvesting a huge chunk of its profits at a high rate of return. This of course has caused the company to see substantial growth in its earnings. That being so, according to the latest industry analyst forecasts, the company's earnings are expected to shrink in the future. To know more about the latest analysts predictions for the company, check out this visualization of analyst forecasts for the company.
New: AI Stock Screener & Alerts
Our new AI Stock Screener scans the market every day to uncover opportunities.
• Dividend Powerhouses (3%+ Yield)• Undervalued Small Caps with Insider Buying• High growth Tech and AI CompaniesOr build your own from over 50 metrics.
Explore Now for FreeHave feedback on this article? Concerned about the content? Get in touch with us directly. Alternatively, email editorial-team (at) simplywallst.com.This article by Simply Wall St is general in nature. We provide commentary based on historical data and analyst forecasts only using an unbiased methodology and our articles are not intended to be financial advice. It does not constitute a recommendation to buy or sell any stock, and does not take account of your objectives, or your financial situation. We aim to bring you long-term focused analysis driven by fundamental data. Note that our analysis may not factor in the latest price-sensitive company announcements or qualitative material. Simply Wall St has no position in any stocks mentioned.
免责声明:投资有风险,本文并非投资建议,以上内容不应被视为任何金融产品的购买或出售要约、建议或邀请,作者或其他用户的任何相关讨论、评论或帖子也不应被视为此类内容。本文仅供一般参考,不考虑您的个人投资目标、财务状况或需求。TTM对信息的准确性和完整性不承担任何责任或保证,投资者应自行研究并在投资前寻求专业建议。
热议股票
- 1
- 2
- 3
- 4
- 5
- 6
- 7
- 8
- 9
- 10