HBAR Rides the Bull: An 11% Surge Points to More Gains Ahead
- HBAR surged 11% in 24 hours, backed by rising demand and bullish technical indicators signaling the potential for further gains.
- Super Trend support at $0.23 signals bullish momentum; breaking $0.39 could mark a new three-year high.
- Rising Chaikin Money Flow (CMF) suggests strong buying pressure, supporting the likelihood of sustained upward price movement.
HBAR, the native token powering the Hedera Hashgraph distributed ledger, has seen an 11% price surge in the past 24 hours. This price rally comes amidst a noticeable rise in demand for the token in the past few days.
Technical analysis suggests that HBAR may be poised for further gains. This analysis highlights price levels that token holders need to pay attention to.
Hedera Token Holders Intensify Accumulation
Readings from HBAR’s daily chart show that despite its recent pullback, its price has remained above the Super Trend indicator, which continues to offer dynamic support at $0.23.
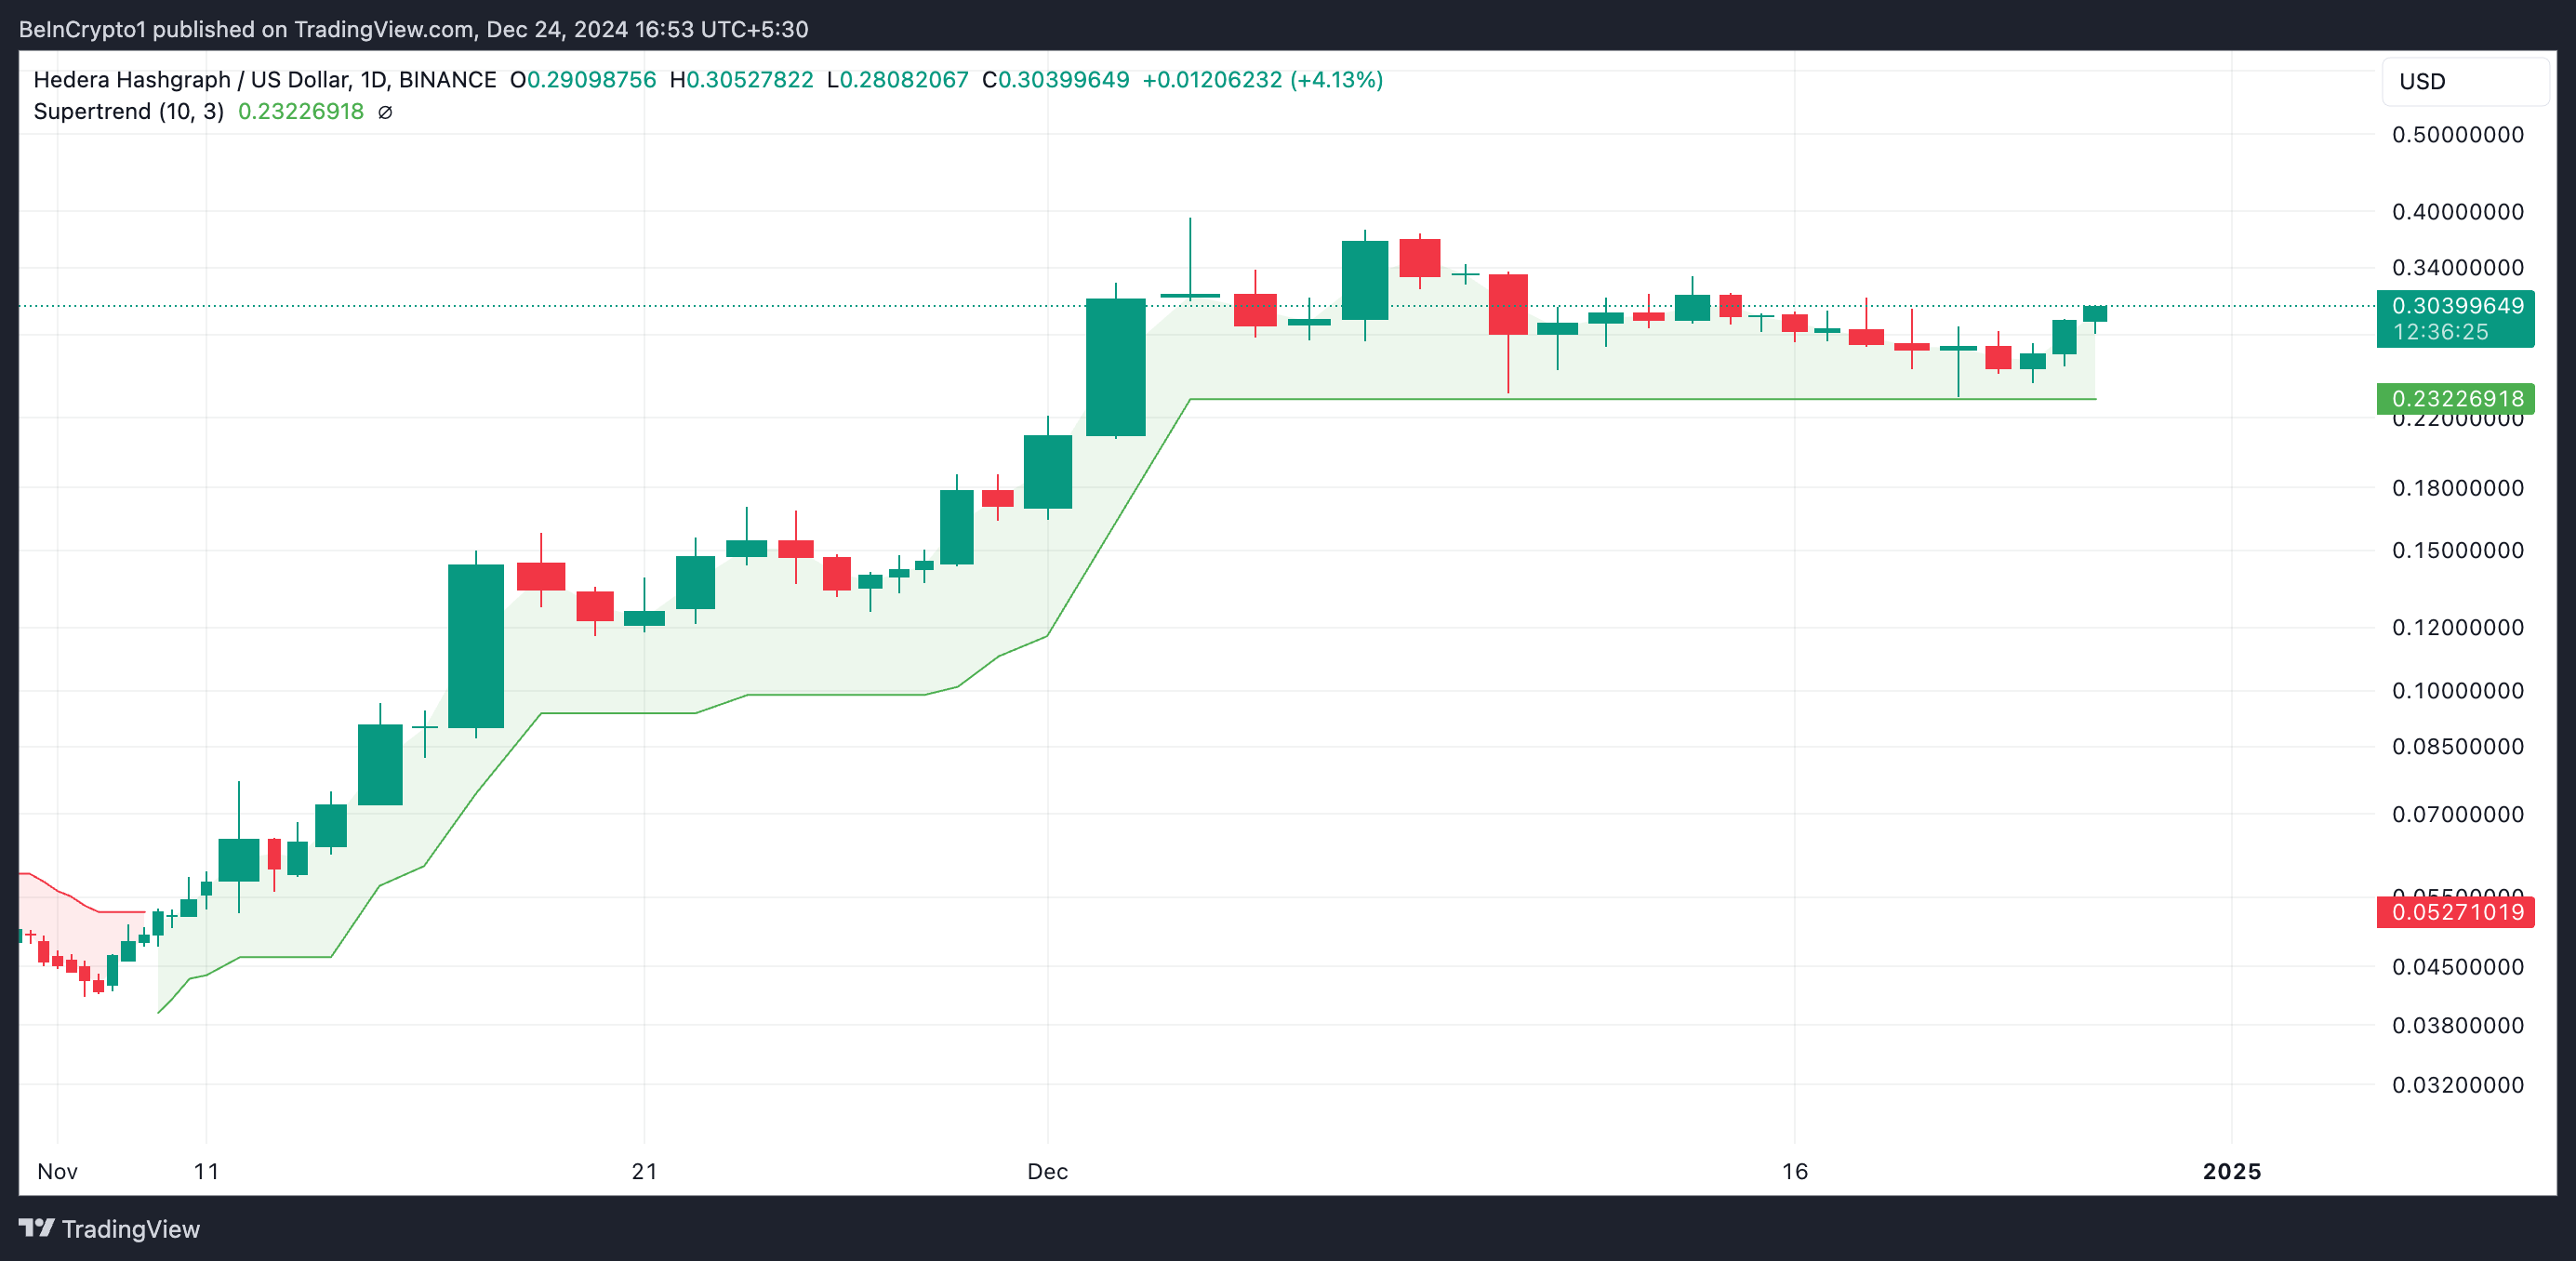
The Super Trend indicator tracks the direction and strength of an asset’s price trend. It is displayed as a line on the price chart, changing color to signify the trend: green for an uptrend and red for a downtrend.
If an asset’s price is above the Super Trend line, it signals bullish momentum in the market. In this scenario, this line offers dynamic support, and as long as the price remains above it, the bullish trend is likely to continue.
Furthermore, HBAR’s rising Chaikin Money Flow (CMF) hints at the likelihood of a sustained rally. At press time, this is at 0.05.
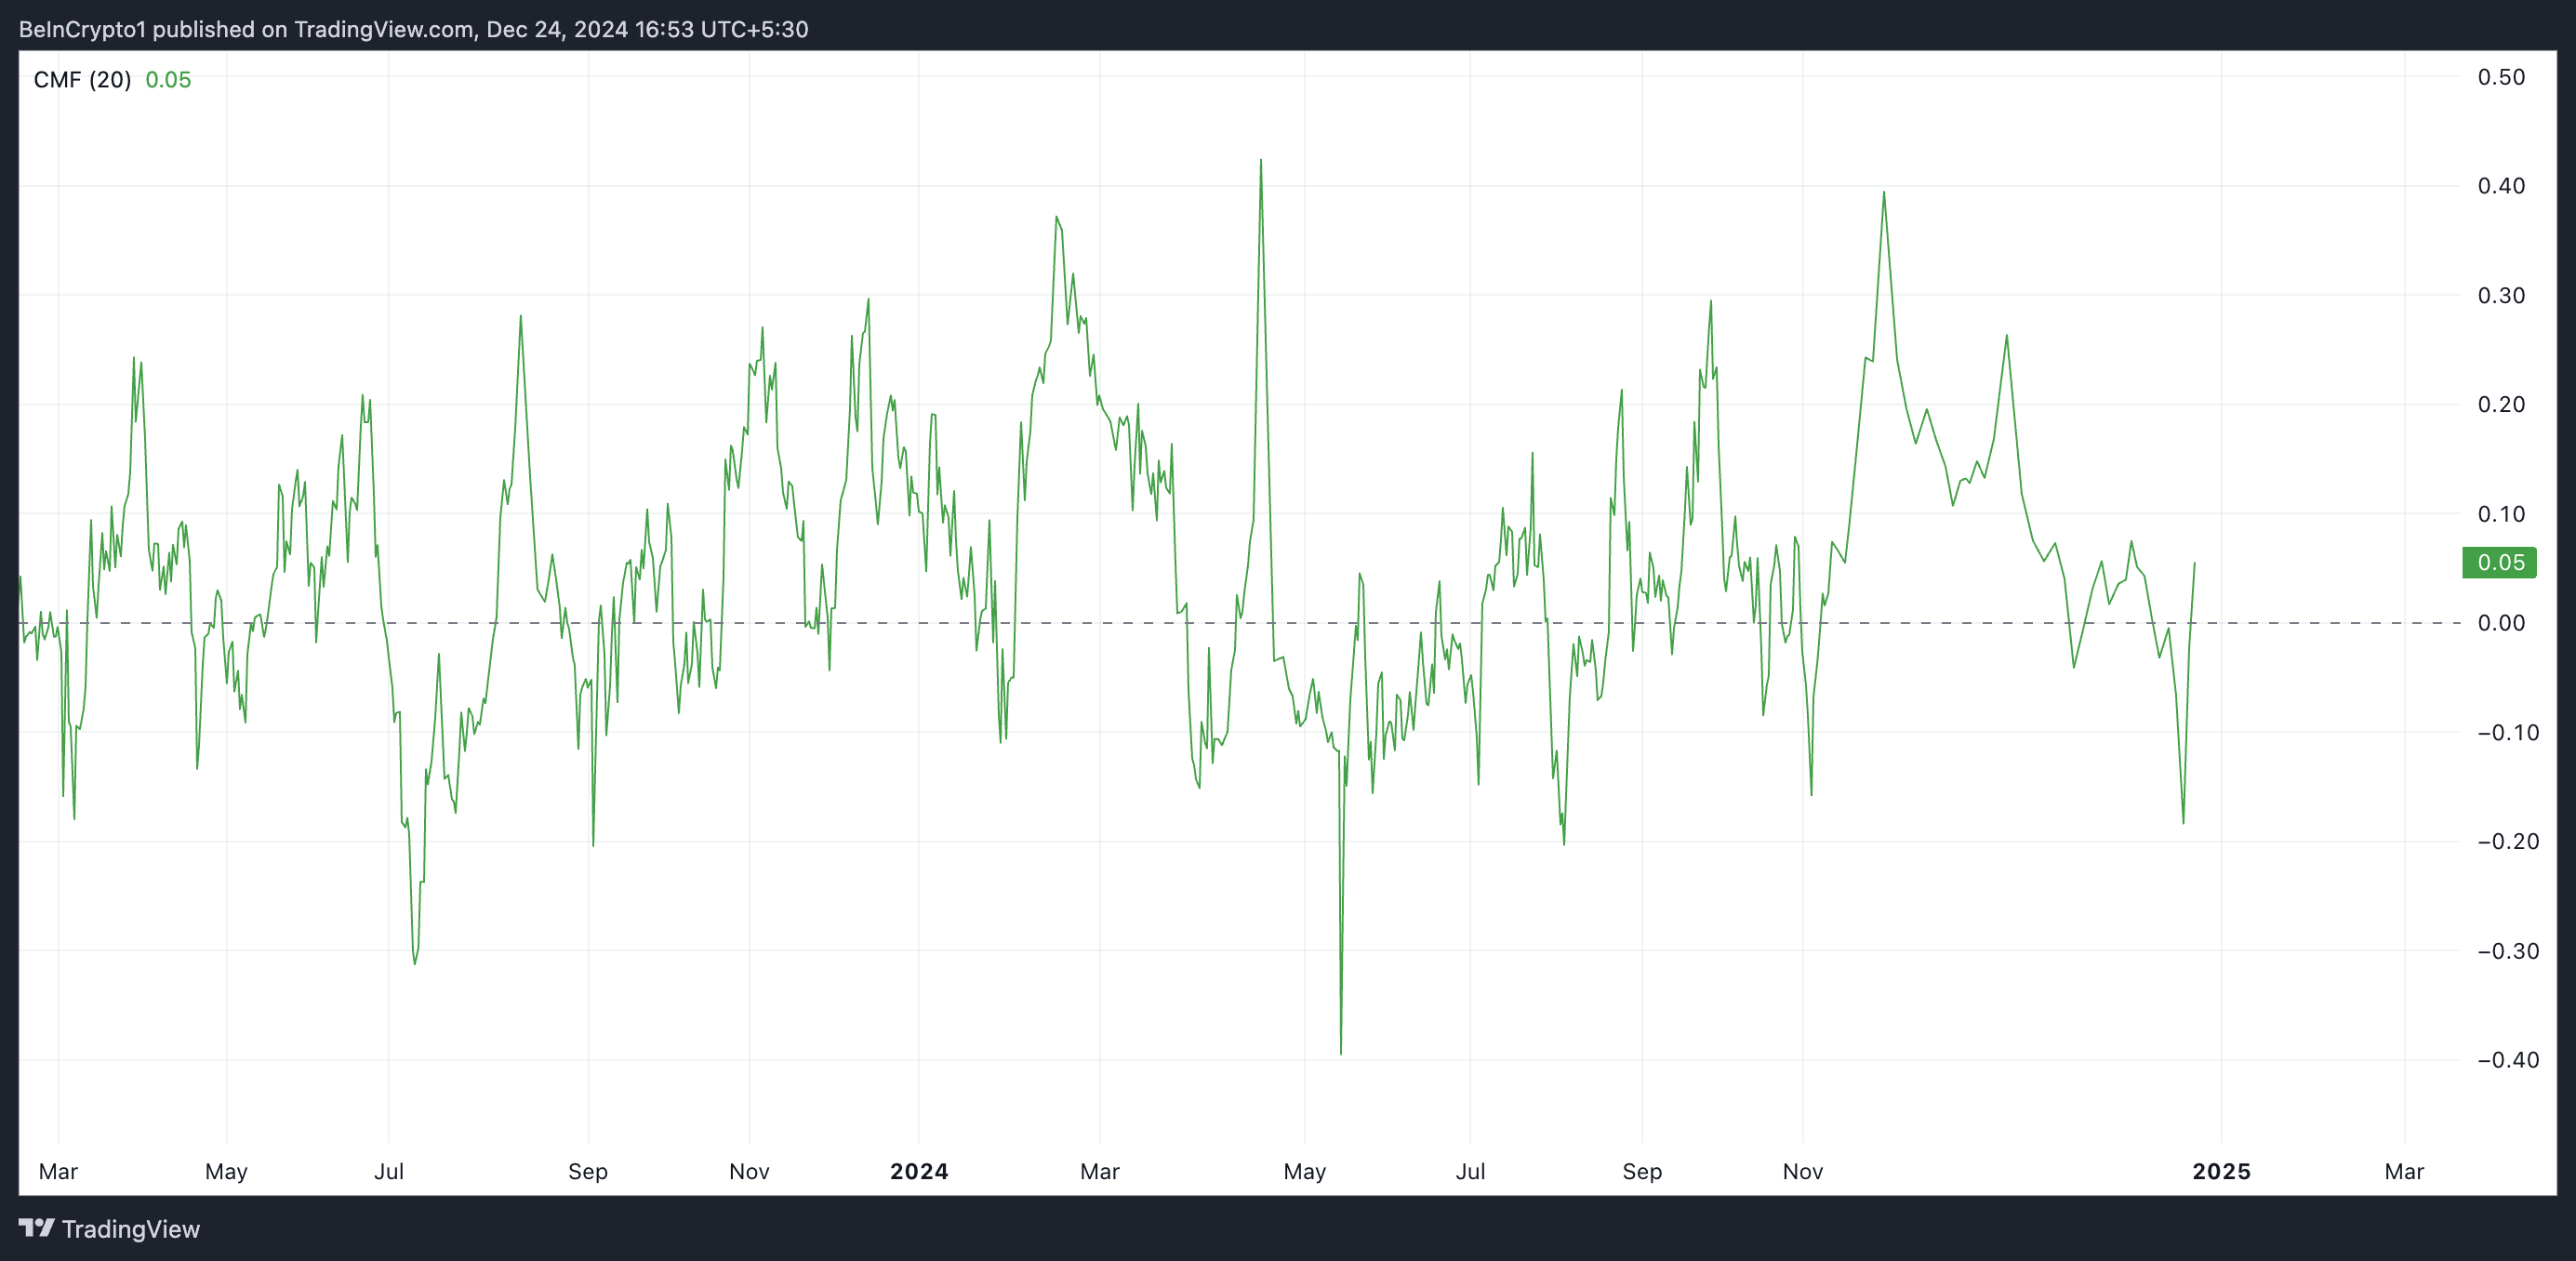
This indicator measures money flows into and out of an asset’s market. As with HBAR, when its value is positive during a price rally, it indicates strong buying pressure as more volume is flowing into the asset than out. This suggests that the price rally is supported by actual accumulation, increasing the likelihood of a sustained uptrend.
HBAR Price Prediction: Bulls Eye $0.39 While Bears Target $0.24
According to its Fibonacci Retracement tool, HBAR’s price will revisit its three-year high of $0.39 and rally past it if accumulation persists. That price level must be flipped into a support floor for this to happen.
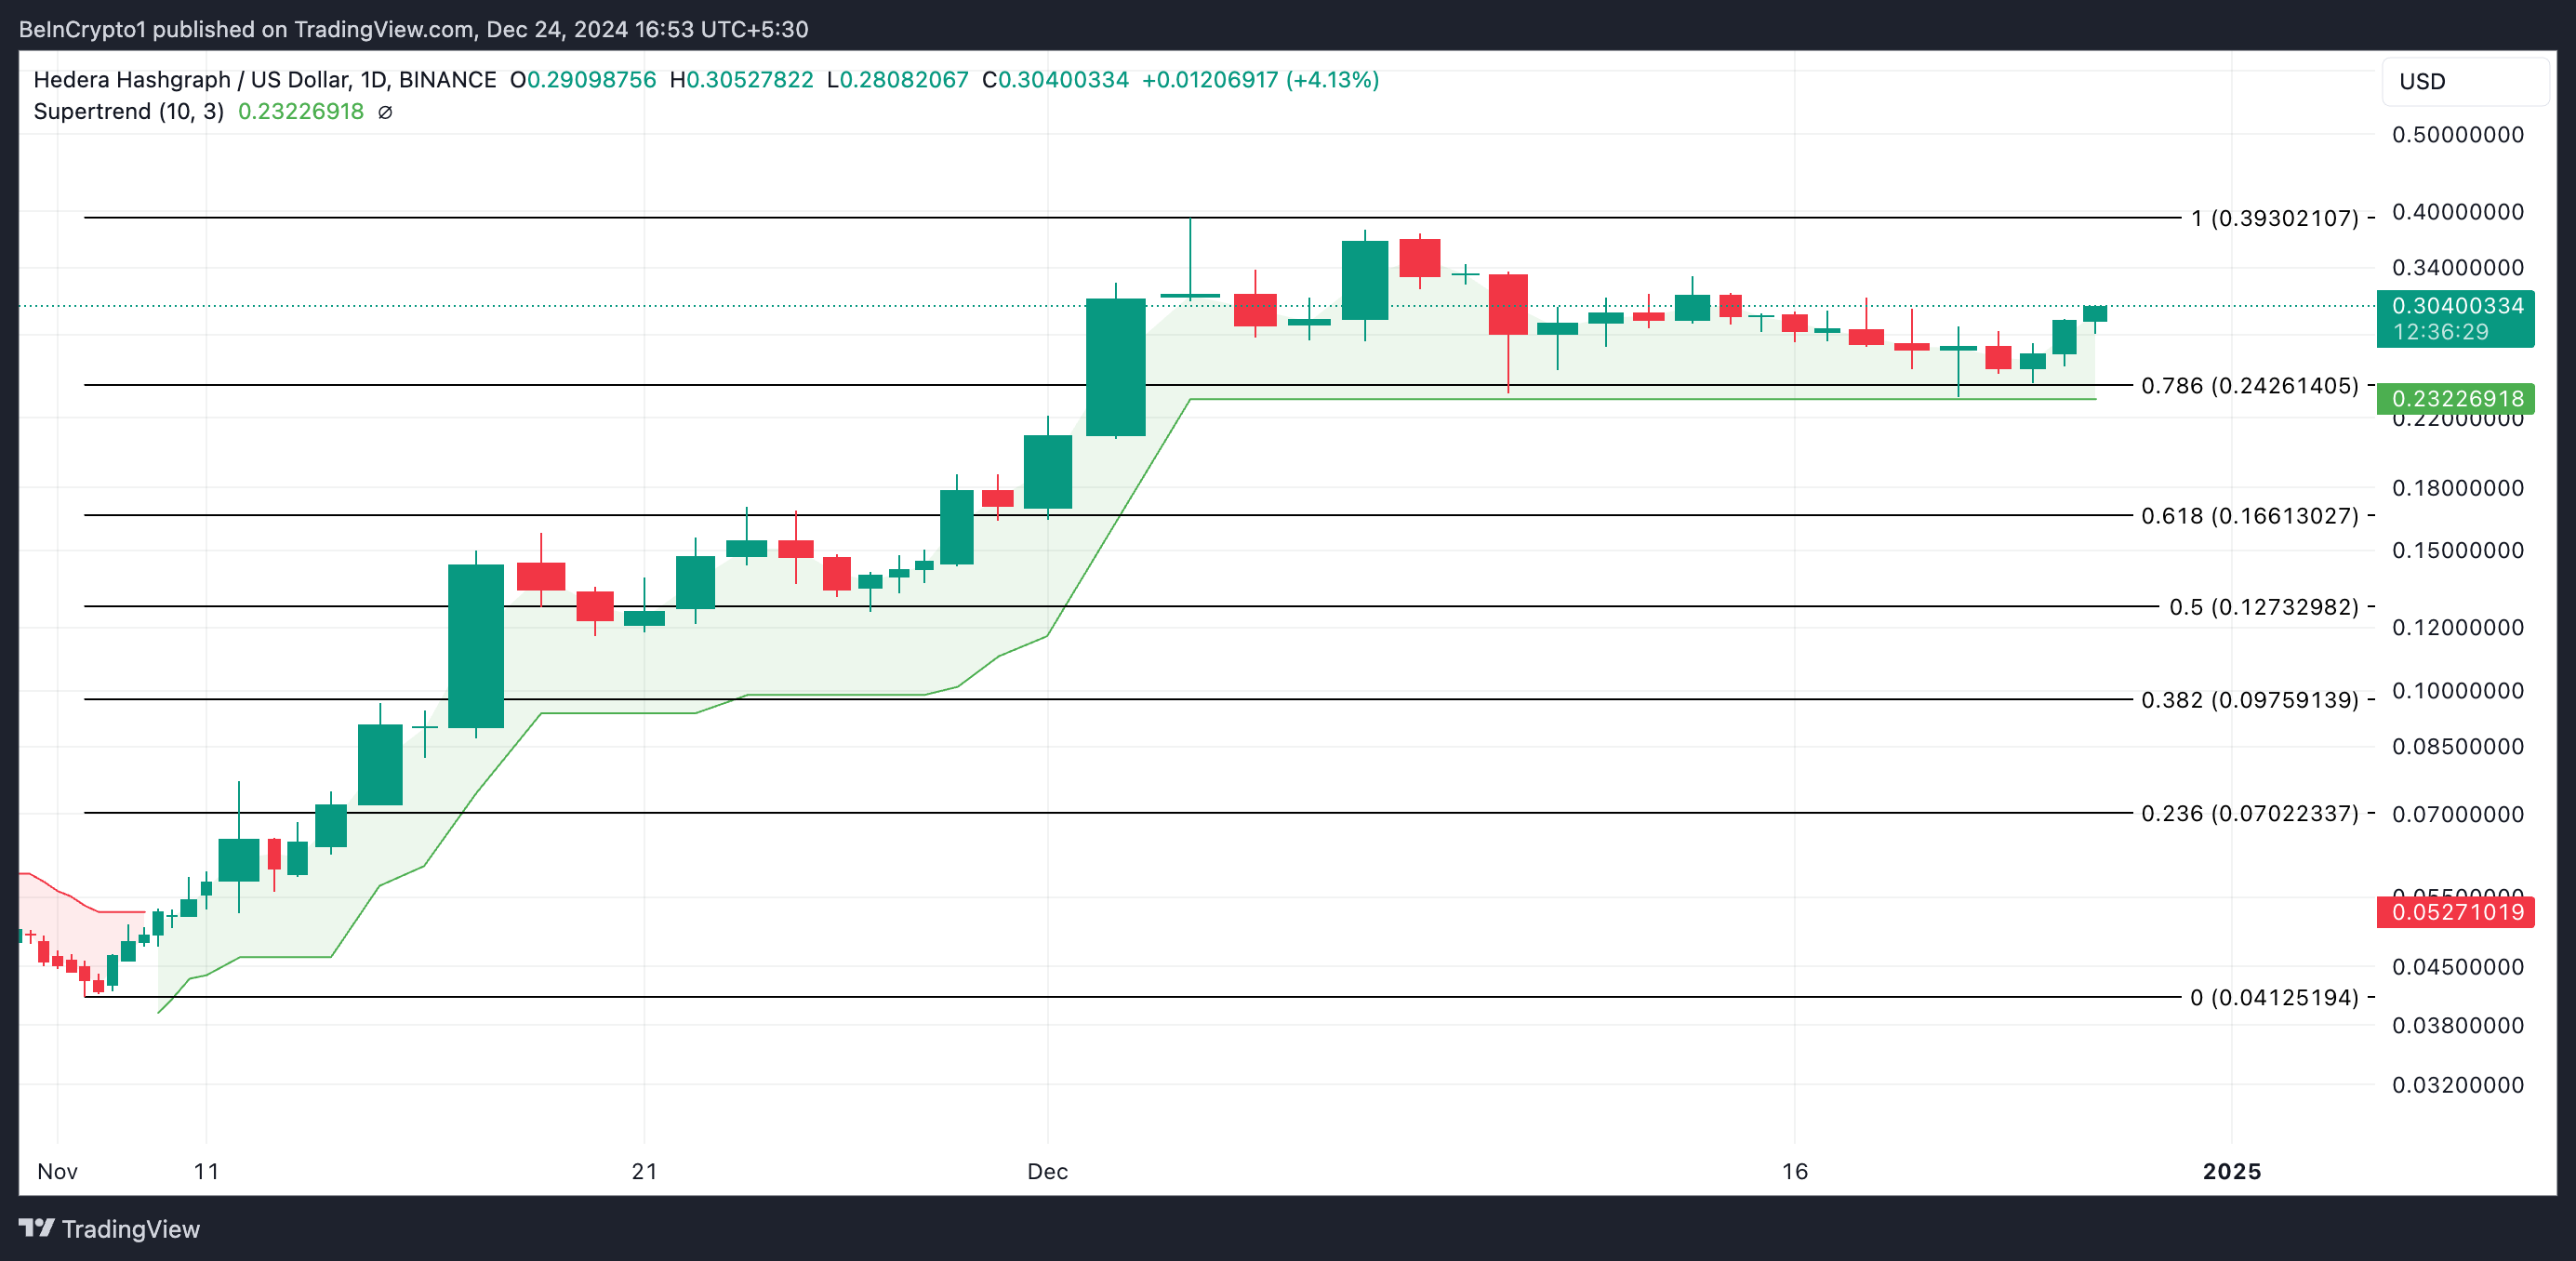
On the other hand, if selloffs resurge, HBAR’s price will shed some of its recent gains and trend toward $0.24. A break below this level will cause a further decline to the Super Trend’s dynamic support of $0.23. If this level fails to hold, the HBAR token price may plunge to $0.16.
免责声明:投资有风险,本文并非投资建议,以上内容不应被视为任何金融产品的购买或出售要约、建议或邀请,作者或其他用户的任何相关讨论、评论或帖子也不应被视为此类内容。本文仅供一般参考,不考虑您的个人投资目标、财务状况或需求。TTM对信息的准确性和完整性不承担任何责任或保证,投资者应自行研究并在投资前寻求专业建议。
热议股票
- 1
- 2
- 3
- 4
- 5
- 6
- 7
- 8
- 9
- 10