Investors one-year returns in AOM International Group (HKG:381) have not grown faster than the company's underlying earnings growth
The last three months have been tough on AOM International Group Company Limited (HKG:381) shareholders, who have seen the share price decline a rather worrying 45%. But over the last year the share price has taken off like one of Elon Musk's rockets. In that time, shareholders have had the pleasure of a 575% boost to the share price. So we wouldn't blame sellers for taking some profits. Only time will tell if there is still too much optimism currently reflected in the share price. It really delights us to see such great share price performance for investors.
While the stock has fallen 15% this week, it's worth focusing on the longer term and seeing if the stocks historical returns have been driven by the underlying fundamentals.
View our latest analysis for AOM International Group
In his essay The Superinvestors of Graham-and-Doddsville Warren Buffett described how share prices do not always rationally reflect the value of a business. One way to examine how market sentiment has changed over time is to look at the interaction between a company's share price and its earnings per share (EPS).
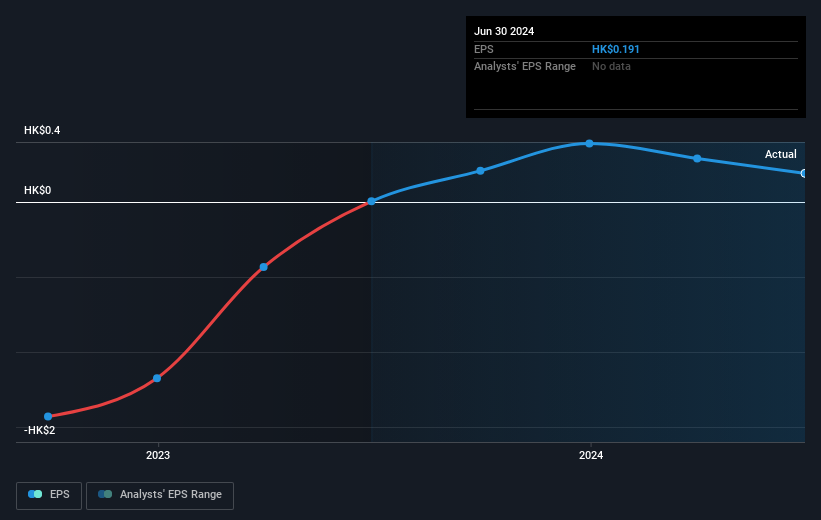
During the last year AOM International Group saw its earnings per share (EPS) increase strongly. This remarkable growth rate may not be sustainable, but it is still impressive. So we're unsurprised to see the share price gaining ground. Strong growth like this can be evidence of a fundamental inflection point in the business, making it a good time to investigate the stock more closely.
You can see below how EPS has changed over time (discover the exact values by clicking on the image).
We consider it positive that insiders have made significant purchases in the last year. Having said that, most people consider earnings and revenue growth trends to be a more meaningful guide to the business. It might be well worthwhile taking a look at our free report on AOM International Group's earnings, revenue and cash flow.
A Different Perspective
It's nice to see that AOM International Group shareholders have received a total shareholder return of 575% over the last year. That certainly beats the loss of about 14% per year over the last half decade. We generally put more weight on the long term performance over the short term, but the recent improvement could hint at a (positive) inflection point within the business. I find it very interesting to look at share price over the long term as a proxy for business performance. But to truly gain insight, we need to consider other information, too. Take risks, for example - AOM International Group has 4 warning signs (and 3 which can't be ignored) we think you should know about.
AOM International Group is not the only stock insiders are buying. So take a peek at this free list of small cap companies at attractive valuations which insiders have been buying.
Please note, the market returns quoted in this article reflect the market weighted average returns of stocks that currently trade on Hong Kong exchanges.
New: Manage All Your Stock Portfolios in One Place
We've created the ultimate portfolio companion for stock investors, and it's free.
• Connect an unlimited number of Portfolios and see your total in one currency• Be alerted to new Warning Signs or Risks via email or mobile• Track the Fair Value of your stocks
Try a Demo Portfolio for FreeHave feedback on this article? Concerned about the content? Get in touch with us directly. Alternatively, email editorial-team (at) simplywallst.com.This article by Simply Wall St is general in nature. We provide commentary based on historical data and analyst forecasts only using an unbiased methodology and our articles are not intended to be financial advice. It does not constitute a recommendation to buy or sell any stock, and does not take account of your objectives, or your financial situation. We aim to bring you long-term focused analysis driven by fundamental data. Note that our analysis may not factor in the latest price-sensitive company announcements or qualitative material. Simply Wall St has no position in any stocks mentioned.
免责声明:投资有风险,本文并非投资建议,以上内容不应被视为任何金融产品的购买或出售要约、建议或邀请,作者或其他用户的任何相关讨论、评论或帖子也不应被视为此类内容。本文仅供一般参考,不考虑您的个人投资目标、财务状况或需求。TTM对信息的准确性和完整性不承担任何责任或保证,投资者应自行研究并在投资前寻求专业建议。
热议股票
- 1
- 2
- 3
- 4
- 5
- 6
- 7
- 8
- 9
- 10