Here's What's Concerning About HM International Holdings' (HKG:8416) Returns On Capital
Ignoring the stock price of a company, what are the underlying trends that tell us a business is past the growth phase? More often than not, we'll see a declining return on capital employed (ROCE) and a declining amount of capital employed. This combination can tell you that not only is the company investing less, it's earning less on what it does invest. On that note, looking into HM International Holdings (HKG:8416), we weren't too upbeat about how things were going.
Understanding Return On Capital Employed (ROCE)
For those that aren't sure what ROCE is, it measures the amount of pre-tax profits a company can generate from the capital employed in its business. Analysts use this formula to calculate it for HM International Holdings:
Return on Capital Employed = Earnings Before Interest and Tax (EBIT) ÷ (Total Assets - Current Liabilities)
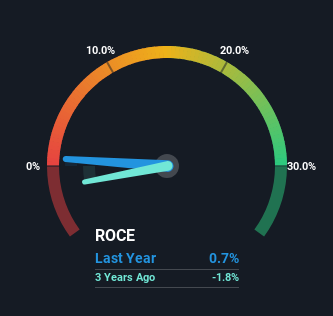
0.0066 = HK$709k ÷ (HK$153m - HK$46m) (Based on the trailing twelve months to June 2024).
Therefore, HM International Holdings has an ROCE of 0.7%. Ultimately, that's a low return and it under-performs the Commercial Services industry average of 7.0%.
Check out our latest analysis for HM International Holdings
While the past is not representative of the future, it can be helpful to know how a company has performed historically, which is why we have this chart above. If you're interested in investigating HM International Holdings' past further, check out this free graph covering HM International Holdings' past earnings, revenue and cash flow.
What Can We Tell From HM International Holdings' ROCE Trend?
We are a bit worried about the trend of returns on capital at HM International Holdings. Unfortunately the returns on capital have diminished from the 9.5% that they were earning five years ago. Meanwhile, capital employed in the business has stayed roughly the flat over the period. Since returns are falling and the business has the same amount of assets employed, this can suggest it's a mature business that hasn't had much growth in the last five years. If these trends continue, we wouldn't expect HM International Holdings to turn into a multi-bagger.
Our Take On HM International Holdings' ROCE
All in all, the lower returns from the same amount of capital employed aren't exactly signs of a compounding machine. Despite the concerning underlying trends, the stock has actually gained 17% over the last five years, so it might be that the investors are expecting the trends to reverse. Regardless, we don't like the trends as they are and if they persist, we think you might find better investments elsewhere.
On a final note, we found 4 warning signs for HM International Holdings (1 makes us a bit uncomfortable) you should be aware of.
If you want to search for solid companies with great earnings, check out this free list of companies with good balance sheets and impressive returns on equity.
Valuation is complex, but we're here to simplify it.
Discover if HM International Holdings might be undervalued or overvalued with our detailed analysis, featuring fair value estimates, potential risks, dividends, insider trades, and its financial condition.
Access Free AnalysisHave feedback on this article? Concerned about the content? Get in touch with us directly. Alternatively, email editorial-team (at) simplywallst.com.This article by Simply Wall St is general in nature. We provide commentary based on historical data and analyst forecasts only using an unbiased methodology and our articles are not intended to be financial advice. It does not constitute a recommendation to buy or sell any stock, and does not take account of your objectives, or your financial situation. We aim to bring you long-term focused analysis driven by fundamental data. Note that our analysis may not factor in the latest price-sensitive company announcements or qualitative material. Simply Wall St has no position in any stocks mentioned.
免责声明:投资有风险,本文并非投资建议,以上内容不应被视为任何金融产品的购买或出售要约、建议或邀请,作者或其他用户的任何相关讨论、评论或帖子也不应被视为此类内容。本文仅供一般参考,不考虑您的个人投资目标、财务状况或需求。TTM对信息的准确性和完整性不承担任何责任或保证,投资者应自行研究并在投资前寻求专业建议。
热议股票
- 1
- 2
- 3
- 4
- 5
- 6
- 7
- 8
- 9
- 10