Coles Group Limited (ASX:COL) Stock's Been Sliding But Fundamentals Look Decent: Will The Market Correct The Share Price In The Future?
With its stock down 5.6% over the past month, it is easy to disregard Coles Group (ASX:COL). But if you pay close attention, you might find that its key financial indicators look quite decent, which could mean that the stock could potentially rise in the long-term given how markets usually reward more resilient long-term fundamentals. In this article, we decided to focus on Coles Group's ROE.
Return on equity or ROE is an important factor to be considered by a shareholder because it tells them how effectively their capital is being reinvested. Put another way, it reveals the company's success at turning shareholder investments into profits.
View our latest analysis for Coles Group
How Is ROE Calculated?
ROE can be calculated by using the formula:
Return on Equity = Net Profit (from continuing operations) ÷ Shareholders' Equity
So, based on the above formula, the ROE for Coles Group is:
29% = AU$1.1b ÷ AU$3.8b (Based on the trailing twelve months to January 2025).
The 'return' is the income the business earned over the last year. One way to conceptualize this is that for each A$1 of shareholders' capital it has, the company made A$0.29 in profit.
Why Is ROE Important For Earnings Growth?
So far, we've learned that ROE is a measure of a company's profitability. Based on how much of its profits the company chooses to reinvest or "retain", we are then able to evaluate a company's future ability to generate profits. Generally speaking, other things being equal, firms with a high return on equity and profit retention, have a higher growth rate than firms that don’t share these attributes.
Coles Group's Earnings Growth And 29% ROE
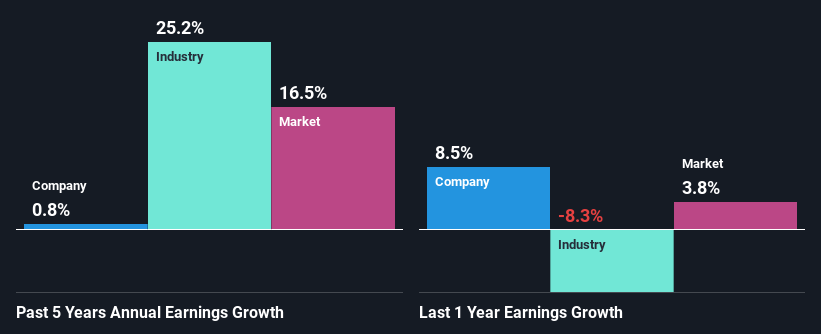
First thing first, we like that Coles Group has an impressive ROE. Additionally, the company's ROE is higher compared to the industry average of 16% which is quite remarkable. Given the circumstances, we can't help but wonder why Coles Group saw little to no growth in the past five years. Based on this, we feel that there might be other reasons which haven't been discussed so far in this article that could be hampering the company's growth. For example, it could be that the company has a high payout ratio or the business has allocated capital poorly, for instance.
As a next step, we compared Coles Group's net income growth with the industry and were disappointed to see that the company's growth is lower than the industry average growth of 25% in the same period.
Earnings growth is a huge factor in stock valuation. It’s important for an investor to know whether the market has priced in the company's expected earnings growth (or decline). Doing so will help them establish if the stock's future looks promising or ominous. What is COL worth today? The intrinsic value infographic in our free research report helps visualize whether COL is currently mispriced by the market.
Is Coles Group Using Its Retained Earnings Effectively?
Coles Group has a high three-year median payout ratio of 81% (or a retention ratio of 19%), meaning that the company is paying most of its profits as dividends to its shareholders. This does go some way in explaining why there's been no growth in its earnings.
In addition, Coles Group has been paying dividends over a period of six years suggesting that keeping up dividend payments is way more important to the management even if it comes at the cost of business growth. Our latest analyst data shows that the future payout ratio of the company over the next three years is expected to be approximately 83%. Accordingly, forecasts suggest that Coles Group's future ROE will be 32% which is again, similar to the current ROE.
Summary
On the whole, we do feel that Coles Group has some positive attributes. Yet, the low earnings growth is a bit concerning, especially given that the company has a high rate of return. Investors could have benefitted from the high ROE, had the company been reinvesting more of its earnings. As discussed earlier, the company is retaining a small portion of its profits. Having said that, looking at the current analyst estimates, we found that the company's earnings are expected to gain momentum. To know more about the company's future earnings growth forecasts take a look at this free report on analyst forecasts for the company to find out more.
New: AI Stock Screener & Alerts
Our new AI Stock Screener scans the market every day to uncover opportunities.
• Dividend Powerhouses (3%+ Yield)• Undervalued Small Caps with Insider Buying• High growth Tech and AI CompaniesOr build your own from over 50 metrics.
Explore Now for FreeHave feedback on this article? Concerned about the content? Get in touch with us directly. Alternatively, email editorial-team (at) simplywallst.com.This article by Simply Wall St is general in nature. We provide commentary based on historical data and analyst forecasts only using an unbiased methodology and our articles are not intended to be financial advice. It does not constitute a recommendation to buy or sell any stock, and does not take account of your objectives, or your financial situation. We aim to bring you long-term focused analysis driven by fundamental data. Note that our analysis may not factor in the latest price-sensitive company announcements or qualitative material. Simply Wall St has no position in any stocks mentioned.
免责声明:投资有风险,本文并非投资建议,以上内容不应被视为任何金融产品的购买或出售要约、建议或邀请,作者或其他用户的任何相关讨论、评论或帖子也不应被视为此类内容。本文仅供一般参考,不考虑您的个人投资目标、财务状况或需求。TTM对信息的准确性和完整性不承担任何责任或保证,投资者应自行研究并在投资前寻求专业建议。
热议股票
- 1
- 2
- 3
- 4
- 5
- 6
- 7
- 8
- 9
- 10