Those who invested in IODM (ASX:IOD) five years ago are up 132%
When you buy shares in a company, it's worth keeping in mind the possibility that it could fail, and you could lose your money. But on the bright side, you can make far more than 100% on a really good stock. For example, the IODM Limited (ASX:IOD) share price has soared 132% in the last half decade. Most would be very happy with that. Meanwhile the share price is 10.0% higher than it was a week ago.
So let's investigate and see if the longer term performance of the company has been in line with the underlying business' progress.
Trump has pledged to "unleash" American oil and gas and these 15 US stocks have developments that are poised to benefit.
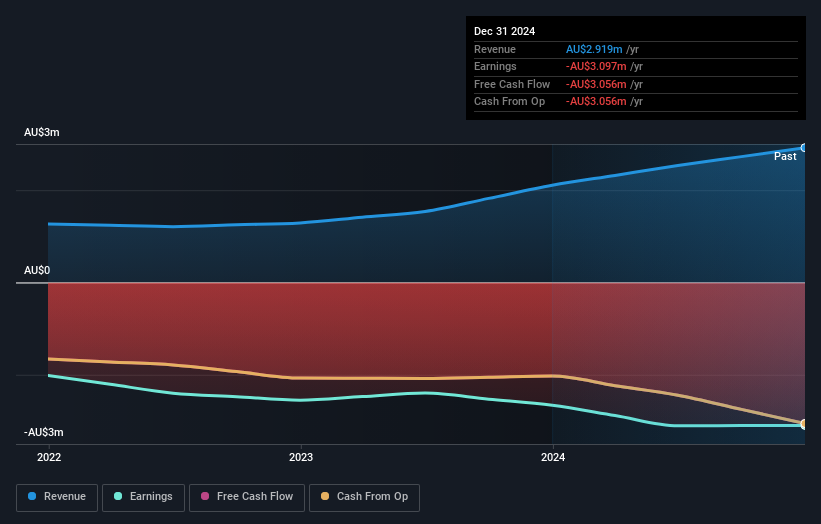
Given that IODM didn't make a profit in the last twelve months, we'll focus on revenue growth to form a quick view of its business development. Shareholders of unprofitable companies usually desire strong revenue growth. That's because fast revenue growth can be easily extrapolated to forecast profits, often of considerable size.
For the last half decade, IODM can boast revenue growth at a rate of 26% per year. That's well above most pre-profit companies. So it's not entirely surprising that the share price reflected this performance by increasing at a rate of 18% per year, in that time. This suggests the market has well and truly recognized the progress the business has made. IODM seems like a high growth stock - so growth investors might want to add it to their watchlist.
The graphic below depicts how earnings and revenue have changed over time (unveil the exact values by clicking on the image).
You can see how its balance sheet has strengthened (or weakened) over time in this free interactive graphic.
A Different Perspective
While the broader market gained around 4.6% in the last year, IODM shareholders lost 21%. However, keep in mind that even the best stocks will sometimes underperform the market over a twelve month period. On the bright side, long term shareholders have made money, with a gain of 18% per year over half a decade. If the fundamental data continues to indicate long term sustainable growth, the current sell-off could be an opportunity worth considering. I find it very interesting to look at share price over the long term as a proxy for business performance. But to truly gain insight, we need to consider other information, too. Case in point: We've spotted 4 warning signs for IODM you should be aware of, and 2 of them are concerning.
If you are like me, then you will not want to miss this free list of undervalued small caps that insiders are buying.
Please note, the market returns quoted in this article reflect the market weighted average returns of stocks that currently trade on Australian exchanges.
If you're looking to trade IODM, open an account with the lowest-cost platform trusted by professionals, Interactive Brokers.
With clients in over 200 countries and territories, and access to 160 markets, IBKR lets you trade stocks, options, futures, forex, bonds and funds from a single integrated account.
Enjoy no hidden fees, no account minimums, and FX conversion rates as low as 0.03%, far better than what most brokers offer.
Sponsored ContentNew: AI Stock Screener & Alerts
Our new AI Stock Screener scans the market every day to uncover opportunities.
• Dividend Powerhouses (3%+ Yield)• Undervalued Small Caps with Insider Buying• High growth Tech and AI CompaniesOr build your own from over 50 metrics.
Explore Now for FreeHave feedback on this article? Concerned about the content? Get in touch with us directly. Alternatively, email editorial-team (at) simplywallst.com.This article by Simply Wall St is general in nature. We provide commentary based on historical data and analyst forecasts only using an unbiased methodology and our articles are not intended to be financial advice. It does not constitute a recommendation to buy or sell any stock, and does not take account of your objectives, or your financial situation. We aim to bring you long-term focused analysis driven by fundamental data. Note that our analysis may not factor in the latest price-sensitive company announcements or qualitative material. Simply Wall St has no position in any stocks mentioned.
免责声明:投资有风险,本文并非投资建议,以上内容不应被视为任何金融产品的购买或出售要约、建议或邀请,作者或其他用户的任何相关讨论、评论或帖子也不应被视为此类内容。本文仅供一般参考,不考虑您的个人投资目标、财务状况或需求。TTM对信息的准确性和完整性不承担任何责任或保证,投资者应自行研究并在投资前寻求专业建议。
热议股票
- 1
- 2
- 3
- 4
- 5
- 6
- 7
- 8
- 9
- 10