Investing in Clearway Energy (NYSE:CWEN.A) five years ago would have delivered you a 119% gain
When you buy and hold a stock for the long term, you definitely want it to provide a positive return. Furthermore, you'd generally like to see the share price rise faster than the market. Unfortunately for shareholders, while the Clearway Energy, Inc. (NYSE:CWEN.A) share price is up 68% in the last five years, that's less than the market return. However, more recent buyers should be happy with the increase of 32% over the last year.
With that in mind, it's worth seeing if the company's underlying fundamentals have been the driver of long term performance, or if there are some discrepancies.
This technology could replace computers: discover the 20 stocks are working to make quantum computing a reality.
While markets are a powerful pricing mechanism, share prices reflect investor sentiment, not just underlying business performance. One flawed but reasonable way to assess how sentiment around a company has changed is to compare the earnings per share (EPS) with the share price.
During the five years of share price growth, Clearway Energy moved from a loss to profitability. That's generally thought to be a genuine positive, so investors may expect to see an increasing share price. Given that the company made a profit three years ago, but not five years ago, it is worth looking at the share price returns over the last three years, too. We can see that the Clearway Energy share price is down 15% in the last three years. During the same period, EPS grew by 20% each year. It would appear there's a real mismatch between the increasing EPS and the share price, which has declined -5% a year for three years.
You can see below how EPS has changed over time (discover the exact values by clicking on the image).
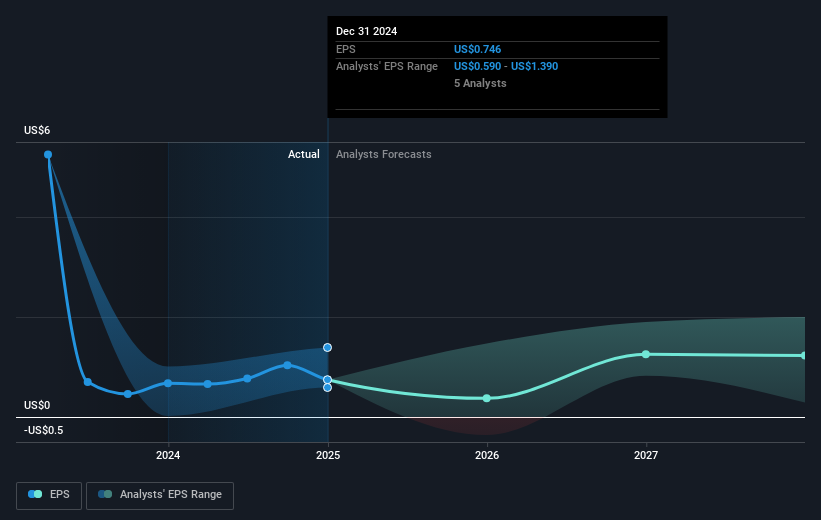
We're pleased to report that the CEO is remunerated more modestly than most CEOs at similarly capitalized companies. But while CEO remuneration is always worth checking, the really important question is whether the company can grow earnings going forward. It might be well worthwhile taking a look at our free report on Clearway Energy's earnings, revenue and cash flow.
What About Dividends?
When looking at investment returns, it is important to consider the difference between total shareholder return (TSR) and share price return. Whereas the share price return only reflects the change in the share price, the TSR includes the value of dividends (assuming they were reinvested) and the benefit of any discounted capital raising or spin-off. Arguably, the TSR gives a more comprehensive picture of the return generated by a stock. In the case of Clearway Energy, it has a TSR of 119% for the last 5 years. That exceeds its share price return that we previously mentioned. This is largely a result of its dividend payments!
A Different Perspective
We're pleased to report that Clearway Energy shareholders have received a total shareholder return of 41% over one year. That's including the dividend. That's better than the annualised return of 17% over half a decade, implying that the company is doing better recently. Given the share price momentum remains strong, it might be worth taking a closer look at the stock, lest you miss an opportunity. It's always interesting to track share price performance over the longer term. But to understand Clearway Energy better, we need to consider many other factors. Consider for instance, the ever-present spectre of investment risk. We've identified 3 warning signs with Clearway Energy (at least 1 which can't be ignored) , and understanding them should be part of your investment process.
If you are like me, then you will not want to miss this free list of undervalued small caps that insiders are buying.
Please note, the market returns quoted in this article reflect the market weighted average returns of stocks that currently trade on American exchanges.
New: AI Stock Screener & Alerts
Our new AI Stock Screener scans the market every day to uncover opportunities.
• Dividend Powerhouses (3%+ Yield)• Undervalued Small Caps with Insider Buying• High growth Tech and AI CompaniesOr build your own from over 50 metrics.
Explore Now for FreeHave feedback on this article? Concerned about the content? Get in touch with us directly. Alternatively, email editorial-team (at) simplywallst.com.This article by Simply Wall St is general in nature. We provide commentary based on historical data and analyst forecasts only using an unbiased methodology and our articles are not intended to be financial advice. It does not constitute a recommendation to buy or sell any stock, and does not take account of your objectives, or your financial situation. We aim to bring you long-term focused analysis driven by fundamental data. Note that our analysis may not factor in the latest price-sensitive company announcements or qualitative material. Simply Wall St has no position in any stocks mentioned.
免责声明:投资有风险,本文并非投资建议,以上内容不应被视为任何金融产品的购买或出售要约、建议或邀请,作者或其他用户的任何相关讨论、评论或帖子也不应被视为此类内容。本文仅供一般参考,不考虑您的个人投资目标、财务状况或需求。TTM对信息的准确性和完整性不承担任何责任或保证,投资者应自行研究并在投资前寻求专业建议。
热议股票
- 1
- 2
- 3
- 4
- 5
- 6
- 7
- 8
- 9
- 10