Revenues Not Telling The Story For JBB Builders International Limited (HKG:1903) After Shares Rise 78%
Despite an already strong run, JBB Builders International Limited (HKG:1903) shares have been powering on, with a gain of 78% in the last thirty days. The annual gain comes to 152% following the latest surge, making investors sit up and take notice.
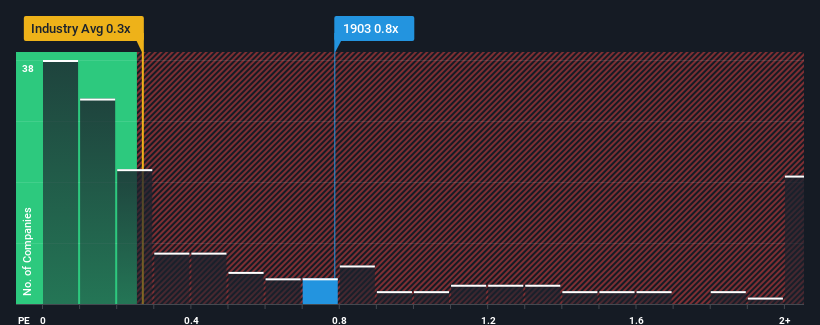
Since its price has surged higher, when almost half of the companies in Hong Kong's Construction industry have price-to-sales ratios (or "P/S") below 0.3x, you may consider JBB Builders International as a stock probably not worth researching with its 0.8x P/S ratio. Nonetheless, we'd need to dig a little deeper to determine if there is a rational basis for the elevated P/S.
We've found 21 US stocks that are forecast to pay a dividend yield of over 6% next year. See the full list for free.
See our latest analysis for JBB Builders International
How Has JBB Builders International Performed Recently?
JBB Builders International certainly has been doing a great job lately as it's been growing its revenue at a really rapid pace. Perhaps the market is expecting future revenue performance to outperform the wider market, which has seemingly got people interested in the stock. However, if this isn't the case, investors might get caught out paying too much for the stock.
We don't have analyst forecasts, but you can see how recent trends are setting up the company for the future by checking out our free report on JBB Builders International's earnings, revenue and cash flow.Do Revenue Forecasts Match The High P/S Ratio?
There's an inherent assumption that a company should outperform the industry for P/S ratios like JBB Builders International's to be considered reasonable.
If we review the last year of revenue growth, the company posted a terrific increase of 90%. The latest three year period has also seen a 19% overall rise in revenue, aided extensively by its short-term performance. So we can start by confirming that the company has actually done a good job of growing revenue over that time.
Weighing that recent medium-term revenue trajectory against the broader industry's one-year forecast for expansion of 6.3% shows it's about the same on an annualised basis.
With this information, we find it interesting that JBB Builders International is trading at a high P/S compared to the industry. It seems most investors are ignoring the fairly average recent growth rates and are willing to pay up for exposure to the stock. Although, additional gains will be difficult to achieve as a continuation of recent revenue trends would weigh down the share price eventually.
The Bottom Line On JBB Builders International's P/S
JBB Builders International shares have taken a big step in a northerly direction, but its P/S is elevated as a result. Using the price-to-sales ratio alone to determine if you should sell your stock isn't sensible, however it can be a practical guide to the company's future prospects.
Our look into JBB Builders International has shown that it currently trades on a higher than expected P/S since its recent three-year growth is only in line with the wider industry forecast. Right now we are uncomfortable with the high P/S as this revenue performance isn't likely to support such positive sentiment for long. If recent medium-term revenue trends continue, it will place shareholders' investments at risk and potential investors in danger of paying an unnecessary premium.
Before you take the next step, you should know about the 3 warning signs for JBB Builders International (2 are concerning!) that we have uncovered.
If you're unsure about the strength of JBB Builders International's business, why not explore our interactive list of stocks with solid business fundamentals for some other companies you may have missed.
New: Manage All Your Stock Portfolios in One Place
We've created the ultimate portfolio companion for stock investors, and it's free.
• Connect an unlimited number of Portfolios and see your total in one currency• Be alerted to new Warning Signs or Risks via email or mobile• Track the Fair Value of your stocks
Try a Demo Portfolio for FreeHave feedback on this article? Concerned about the content? Get in touch with us directly. Alternatively, email editorial-team (at) simplywallst.com.This article by Simply Wall St is general in nature. We provide commentary based on historical data and analyst forecasts only using an unbiased methodology and our articles are not intended to be financial advice. It does not constitute a recommendation to buy or sell any stock, and does not take account of your objectives, or your financial situation. We aim to bring you long-term focused analysis driven by fundamental data. Note that our analysis may not factor in the latest price-sensitive company announcements or qualitative material. Simply Wall St has no position in any stocks mentioned.
免责声明:投资有风险,本文并非投资建议,以上内容不应被视为任何金融产品的购买或出售要约、建议或邀请,作者或其他用户的任何相关讨论、评论或帖子也不应被视为此类内容。本文仅供一般参考,不考虑您的个人投资目标、财务状况或需求。TTM对信息的准确性和完整性不承担任何责任或保证,投资者应自行研究并在投资前寻求专业建议。
热议股票
- 1
- 2
- 3
- 4
- 5
- 6
- 7
- 8
- 9
- 10