Red alert: Ethereum price crash to continue as rare pattern forms 6 seconds ago
Ethereum price has been in a strong downward trend against Bitcoin, and a rare chart pattern points to more downside.
Ethereum (ETH) dropped to 0.01890, its lowest level since January 2020 and 80% below its 2021 high.
This decline comes as Ethereum continues to lose market share across key sectors of the crypto industry. DeFi Llama data shows that protocols in its network processed $56 billion in April, lower than Solana’s (SOL) $72 billion.
Ethereum is also losing ground to layer-2 networks, which aim to improve scalability and speed without compromising security.
Base, a layer-2 network created by Coinbase, processed transactions worth $20 billion in April. Unichain, a L2 network recently launched in February, handled $3.4 billion, while Arbitrum processed $14.3 billion. In theory, Ethereum would have handled these transactions.
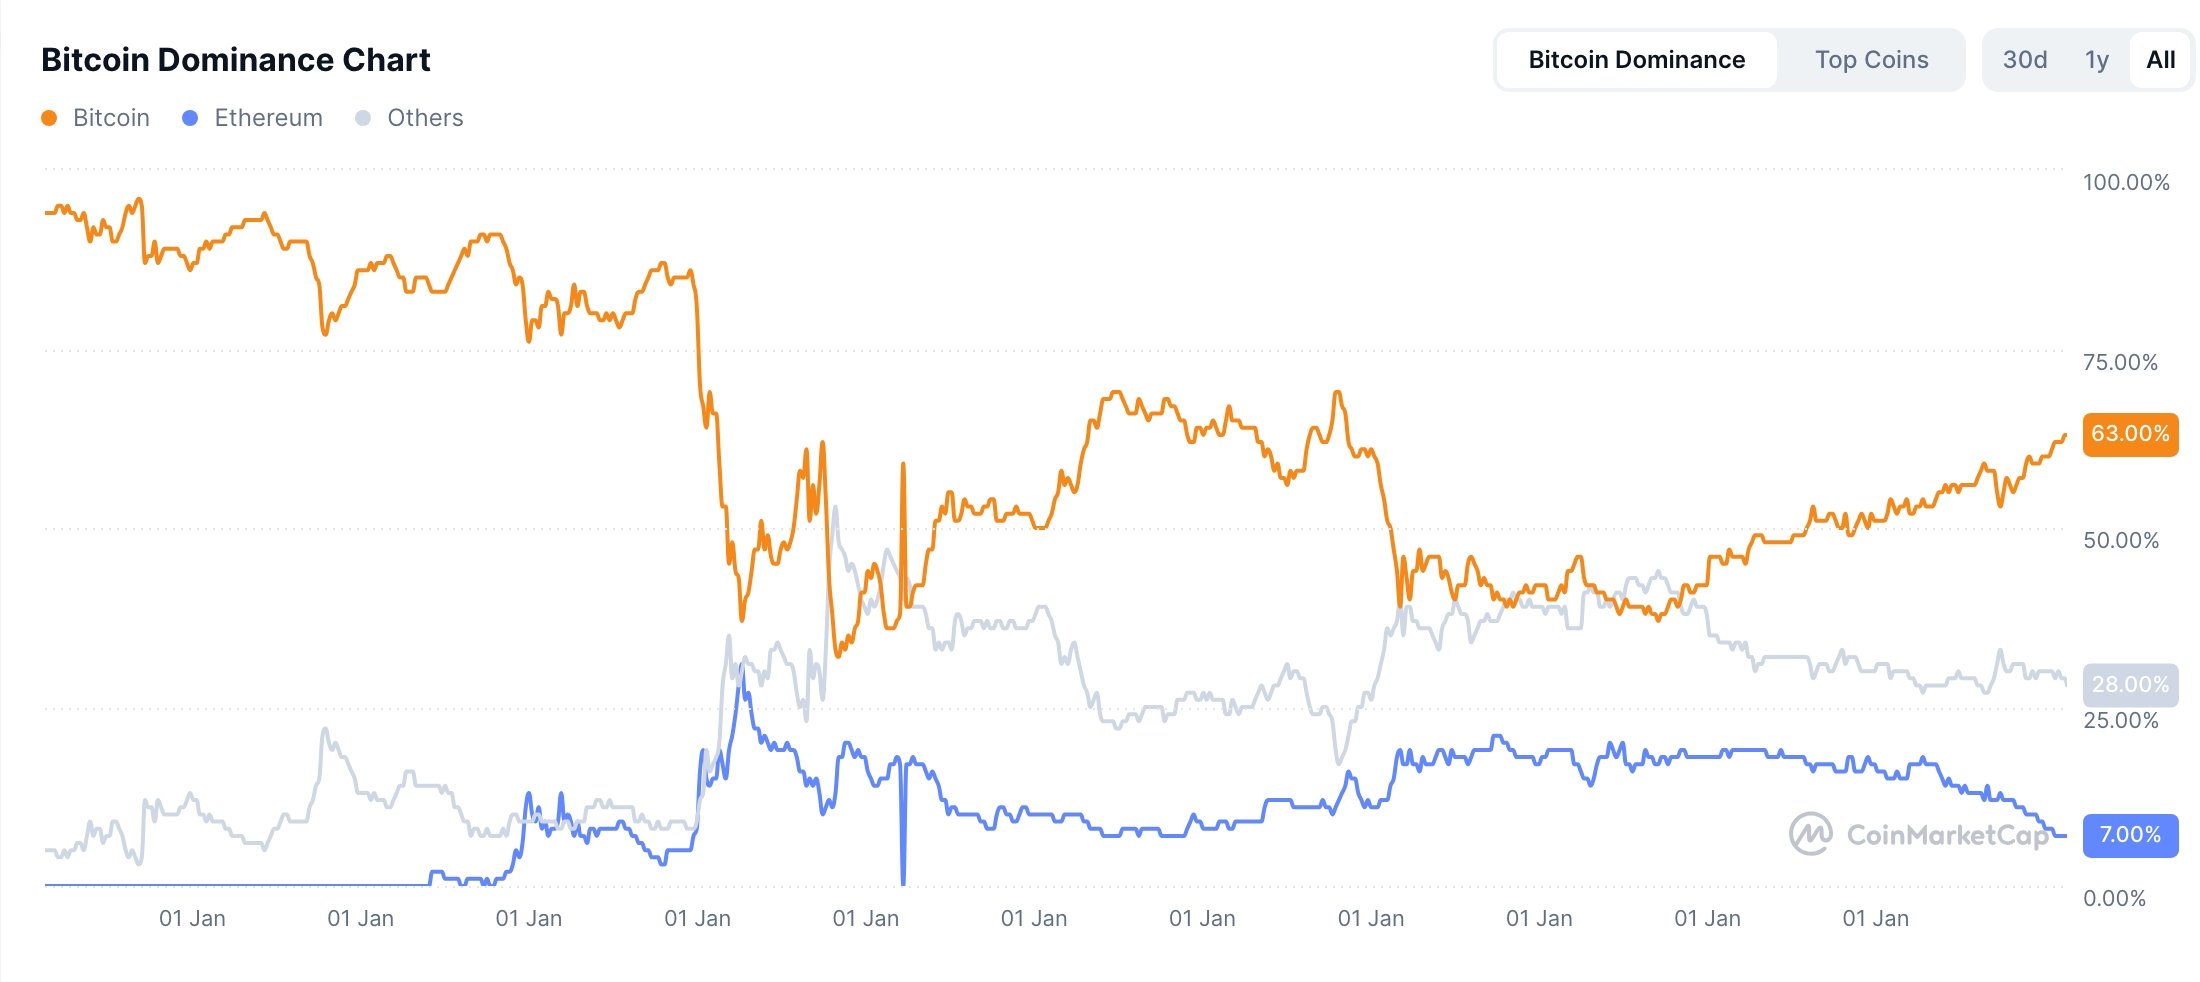
Meanwhile, Ethereum has weakened further as Bitcoin’s dominance in the market has continued to climb. Bitcoin currently holds a 63% market share, up from a year-to-date low of 18% and at its highest level since November 2021. In contrast, Ethereum’s dominance has fallen to 7%, its lowest point since April 2018.

Ethereum price technical analysis

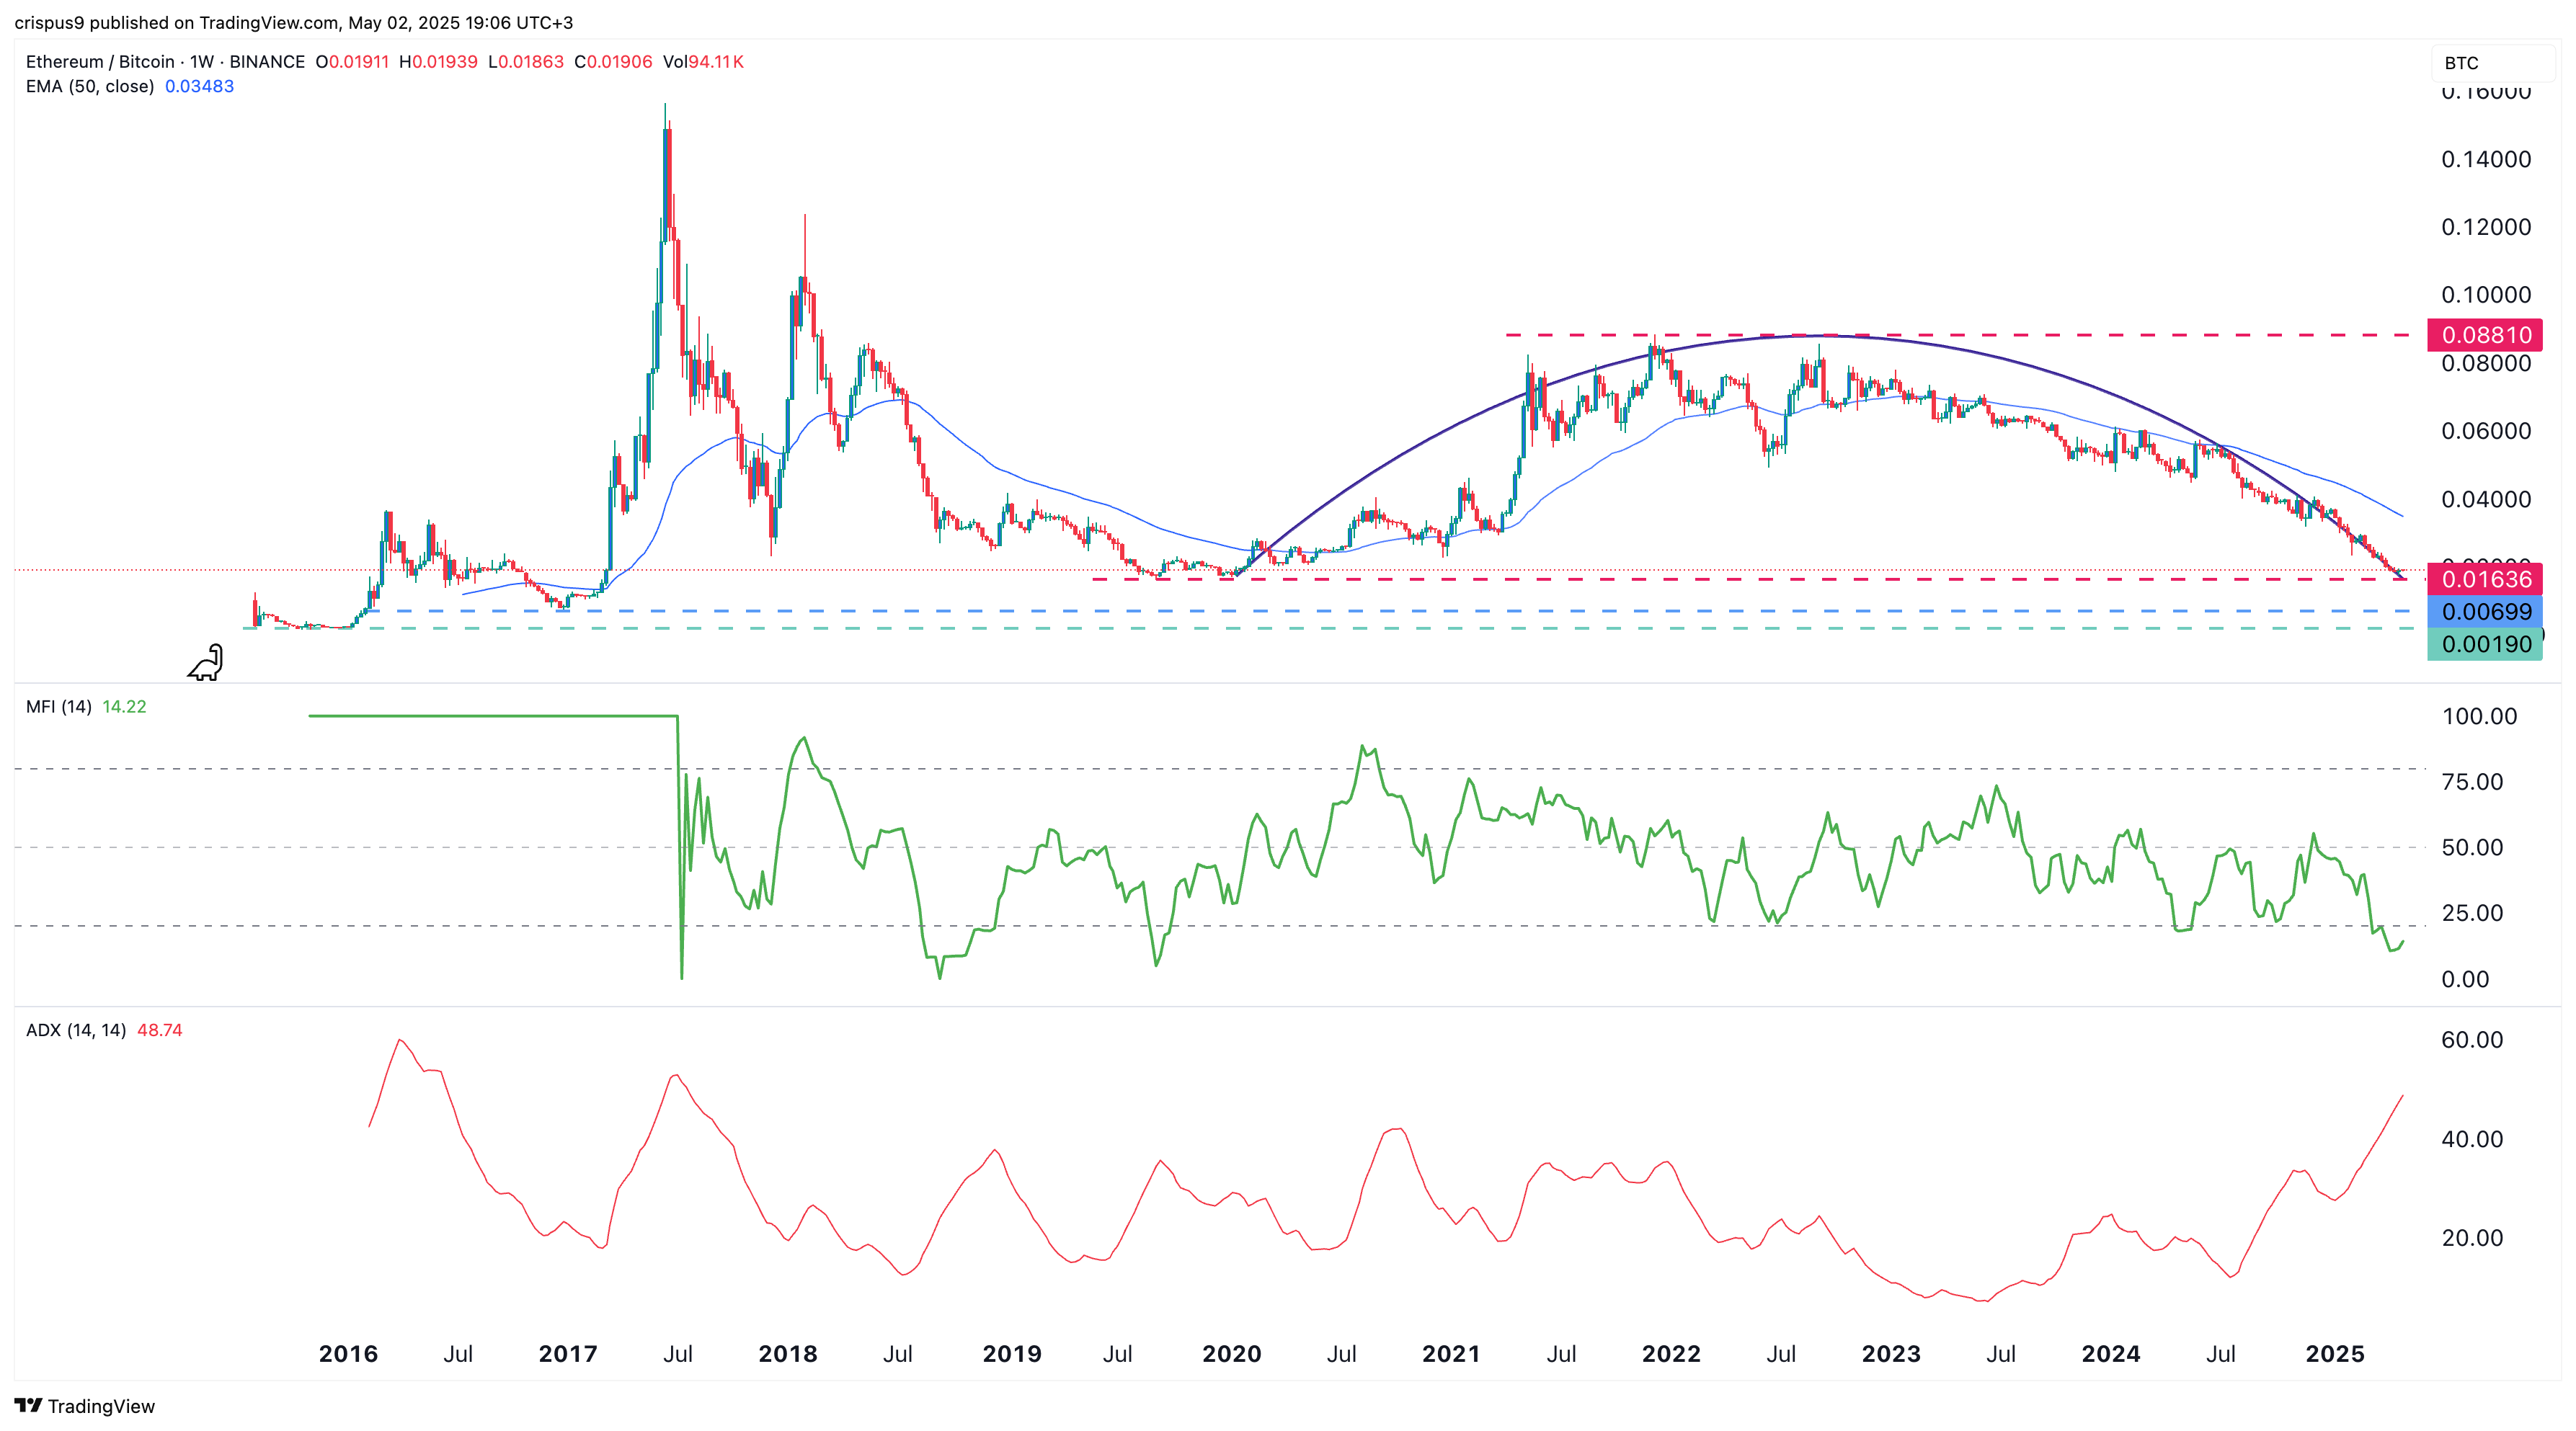
The weekly chart shows that the ETH/BTC pair peaked at 0.08810 in December 2021 and has since plunged 80% to its current 0.01890 level.
Ethereum remains below both the 50-week and 100-week moving averages. Additionally, the Money Flow Index has continued falling and now sits at an oversold level of 14.
The Average Directional Index has risen to 48.75, indicating that bearish momentum is still strong.
Crucially, the pair has formed an inverse cup and handle pattern, a well-known bearish continuation signal. This pattern features a horizontal support line and a rounded top, often preceding further downside. If the pattern plays out, the next level to watch is 0.0070, which marked the bottom in December 2016. A drop below that would set the stage for a possible retest of the all-time low at 0.0019.
免责声明:投资有风险,本文并非投资建议,以上内容不应被视为任何金融产品的购买或出售要约、建议或邀请,作者或其他用户的任何相关讨论、评论或帖子也不应被视为此类内容。本文仅供一般参考,不考虑您的个人投资目标、财务状况或需求。TTM对信息的准确性和完整性不承担任何责任或保证,投资者应自行研究并在投资前寻求专业建议。
热议股票
- 1
- 2
- 3
- 4
- 5
- 6
- 7
- 8
- 9
- 10