Raydium (RAY) Slides 7% as Bearish Indicators Strengthen Across the Board
- Raydium (RAY) price dropped 7.31% in 24 hours, trading at $2.33 with falling volume.
- Market cap slid to $675.23M, while unlocked valuation stands at $1.31B.
Raydium (RAY) faced a sharp market pullback as its price declined to $2.33, marking a daily drop of 7.31%. This sudden downturn erased significant value, driving its market capitalization to $675.23 million. The decline represents a 6.34% contraction in market value. With an unlocked market cap of $1.31 billion, Raydium’s current valuation indicates notable pressure from broader market sentiment.
The trading volume in the past 24 hours plummeted by 15.48%, now standing at $45.03 million. This plunge pushed the market cap ratio to 6.58%, signaling weakening momentum. Despite this, Raydium maintains a total value locked (TVL) of $1.81 billion, which positions its market cap to TVL ratio at 0.3761—a signal of undervaluation by DeFi standards.
Will RAY Surge Back or Plunge Further?
Price action on the daily chart reveals clear signs of a bearish continuation. RAY currently trades at $2.345 after failing to sustain higher lows. If support at $2.30 breaks, the price could descend toward the $2.00 psychological level. Conversely, a bounce from current levels could face resistance near $2.95. A breakout above this range may drive RAY toward $3.50 in a risk-on scenario.
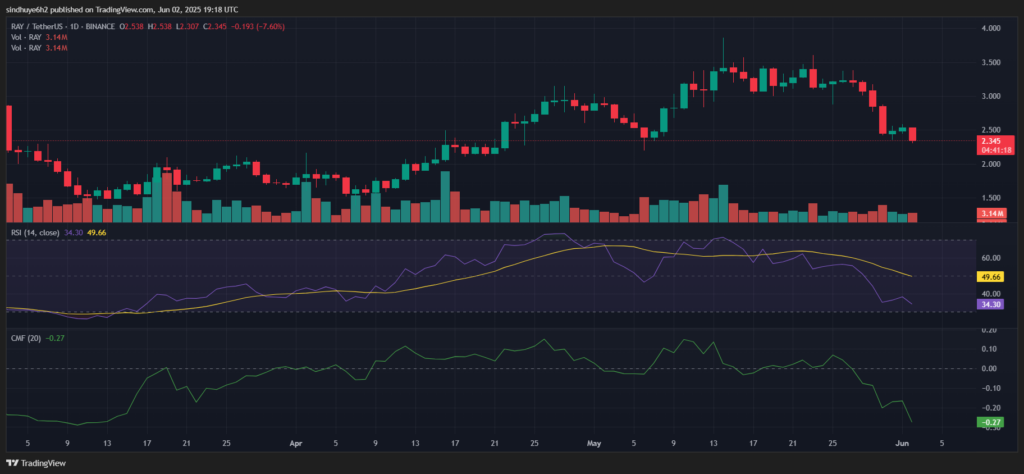
Technicals paint a cautious outlook. The 14-day Relative Strength Index sits at 34.30, nearing oversold conditions. However, its divergence from the RSI average at 49.66 suggests extended weakness and little recovery intent. As a result, bullish momentum remains scarce. The daily moving average, curving downward, reinforces this short-term bearish bias.
The Chaikin Money Flow (CMF) now rests at -0.27, indicating persistent capital outflows. This trend highlights investor hesitancy and declining accumulation. A sustained CMF under zero often precedes further drawdowns unless offset by sudden inflows or volume spikes.
Momentum indicators show no immediate recovery signals. Moreover, moving average convergence-divergence patterns remain unremarkable. If price fails to reclaim the mid-range resistance, further declines appear more likely.
Highlighted Crypto News TodayStrategy Buys 705 Bitcoin for $75M, Boosting Holdings to 580,955 BTC
免责声明:投资有风险,本文并非投资建议,以上内容不应被视为任何金融产品的购买或出售要约、建议或邀请,作者或其他用户的任何相关讨论、评论或帖子也不应被视为此类内容。本文仅供一般参考,不考虑您的个人投资目标、财务状况或需求。TTM对信息的准确性和完整性不承担任何责任或保证,投资者应自行研究并在投资前寻求专业建议。
热议股票
- 1
- 2
- 3
- 4
- 5
- 6
- 7
- 8
- 9
- 10