Shiba Inu price crashes as it eyes a crucial support 6 seconds ago
Shiba Inu price continued its strong downtrend this week, even as its token burn rate surged by over 800%.
Shiba Inu (SHIB) token plunged to a low of $0.00001160, its lowest level since April 9. It has dropped by 35% from its recent peak on May 12.
SHIB price dropped because of the ongoing crypto market crash that has pushed Bitcoin and most altcoins lower.
The sell-off intensified as whales dumped their SHIB holdings. According to Nansen data, whale holdings have declined by over 80% in the last 12 months to 34 billion tokens. Similarly, smart money holdings have fallen by over 35% to 13.1 billion during the same period.
Shiba Inu’s ecosystem is also under pressure. Shibarium’s total value locked (TVL) has dropped by 23% over the past 30 days to $2.6 million. Its total value locked remains significantly smaller than more established layer-2 networks like Arbitrum, Polygon, and Base.
ShibaSwap, the biggest player in Shiba Inu’s ecosystem, has lost market share. Artemis data shows that the number of transaction users dropped to 89 from a high of 374 in March. Similarly, the number of daily transactions has dropped to 141, down from 937 in March.
On the positive side, Shiba Inu’s daily token burn rate surged by 809% on Tuesday, rising to over 17.69 million SHIB. Token burns reduce circulating supply and are generally seen as a bullish signal by long-term investors.
Shiba Inu price technical analysis

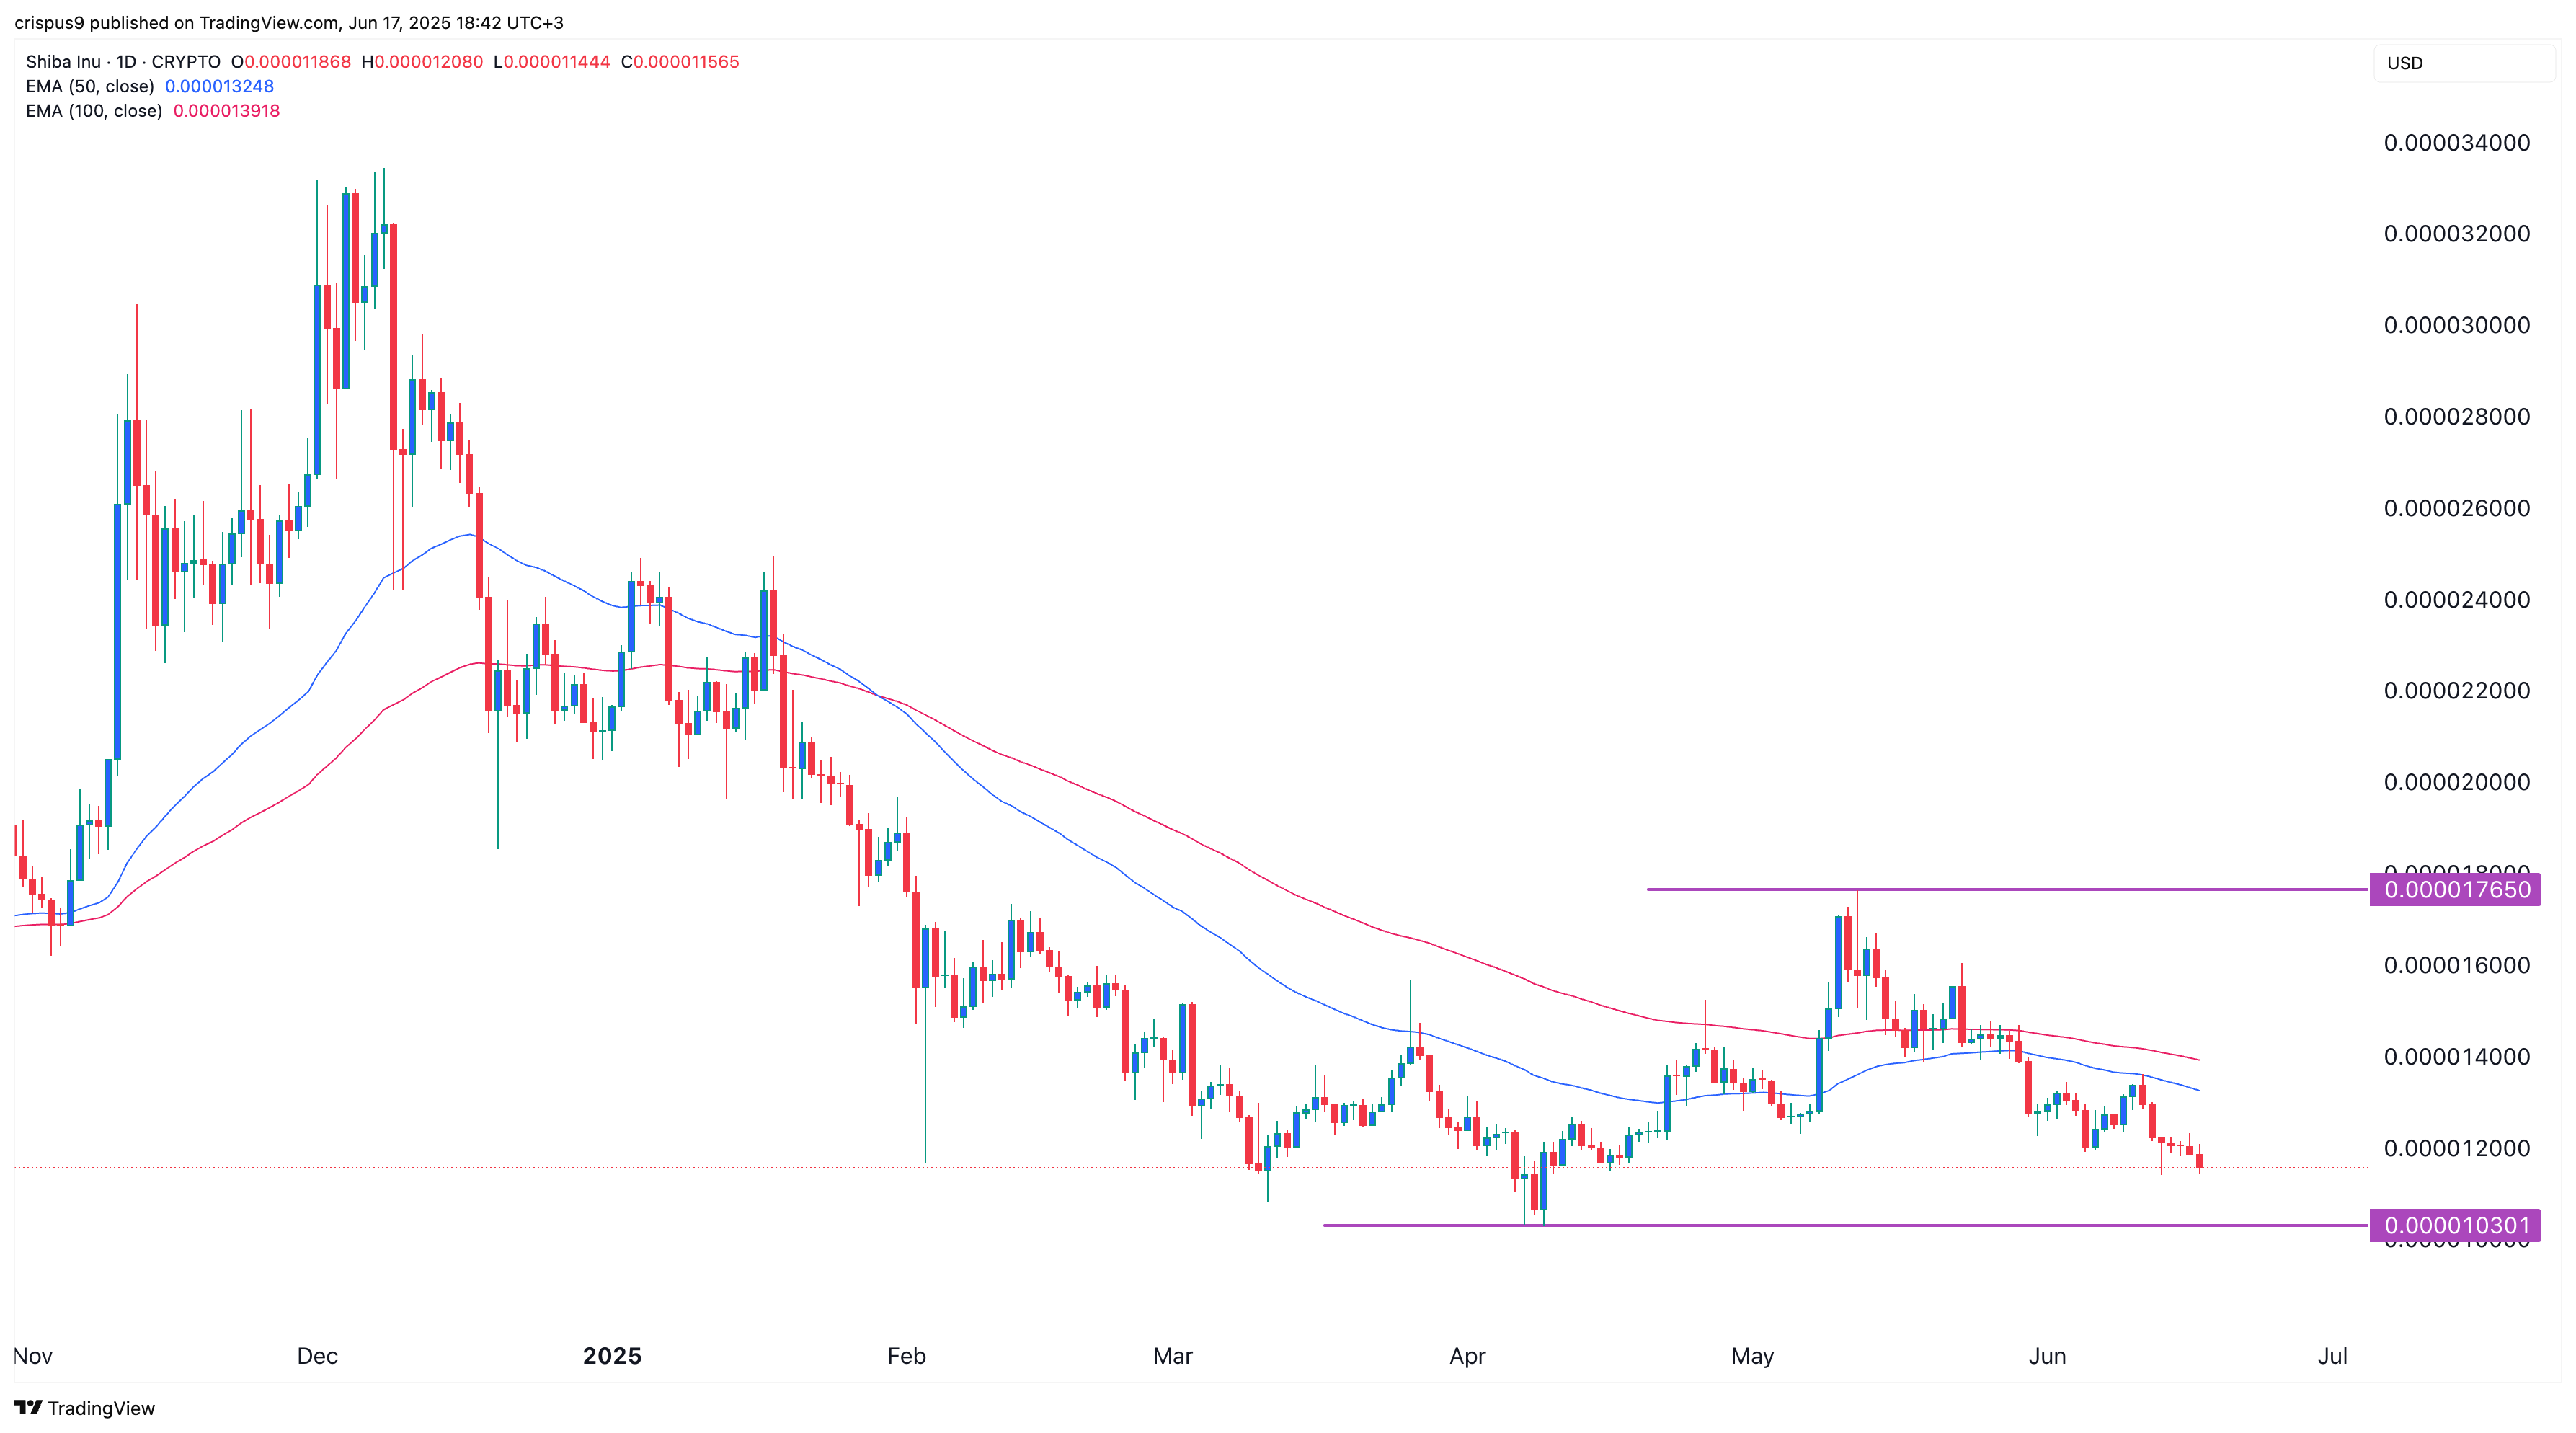
The daily chart shows that SHIB has been in a sustained downtrend over the past few weeks, falling from its May high of $0.00001765 to its current level near $0.00001150.
SHIB has broken below both the 50-day and 100-day moving averages. Most notably, the price is nearing its year-to-date low of $0.00001030.
Technically, SHIB appears to be forming a potential double-bottom pattern, with the neckline at $0.00001765. If the bearish momentum continues, SHIB may test the support level at $0.00001030. A successful hold could trigger a bounce back toward resistance at $0.00001765.
However, a drop below the year-to-date low of $0.000010 would invalidate the double-bottom pattern and suggest further downside ahead.
免责声明:投资有风险,本文并非投资建议,以上内容不应被视为任何金融产品的购买或出售要约、建议或邀请,作者或其他用户的任何相关讨论、评论或帖子也不应被视为此类内容。本文仅供一般参考,不考虑您的个人投资目标、财务状况或需求。TTM对信息的准确性和完整性不承担任何责任或保证,投资者应自行研究并在投资前寻求专业建议。
热议股票
- 1
- 2
- 3
- 4
- 5
- 6
- 7
- 8
- 9
- 10