The Return Trends At NVC International Holdings (HKG:2222) Look Promising
If you're looking for a multi-bagger, there's a few things to keep an eye out for. Typically, we'll want to notice a trend of growing return on capital employed (ROCE) and alongside that, an expanding base of capital employed. Ultimately, this demonstrates that it's a business that is reinvesting profits at increasing rates of return. So on that note, NVC International Holdings (HKG:2222) looks quite promising in regards to its trends of return on capital.
AI is about to change healthcare. These 20 stocks are working on everything from early diagnostics to drug discovery. The best part - they are all under $10bn in marketcap - there is still time to get in early.
What Is Return On Capital Employed (ROCE)?
Just to clarify if you're unsure, ROCE is a metric for evaluating how much pre-tax income (in percentage terms) a company earns on the capital invested in its business. The formula for this calculation on NVC International Holdings is:
Return on Capital Employed = Earnings Before Interest and Tax (EBIT) ÷ (Total Assets - Current Liabilities)
0.0073 = US$3.5m ÷ (US$561m - US$83m) (Based on the trailing twelve months to December 2024).
So, NVC International Holdings has an ROCE of 0.7%. Ultimately, that's a low return and it under-performs the Household Products industry average of 10.0%.
View our latest analysis for NVC International Holdings
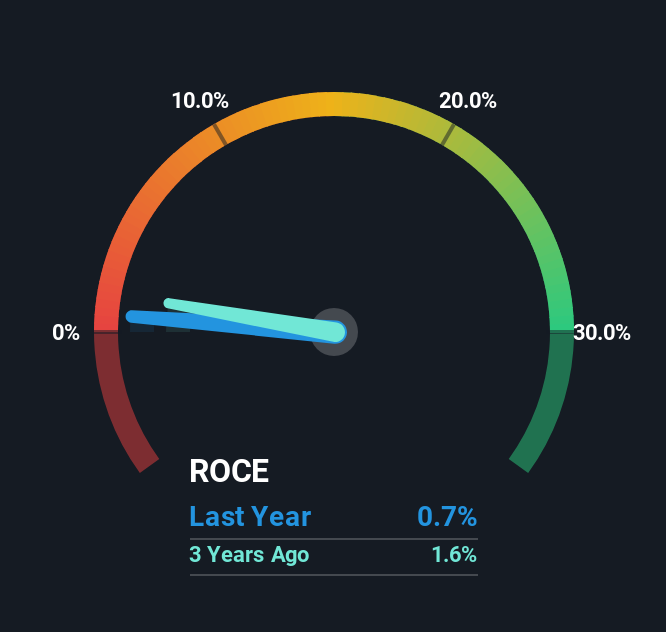
Historical performance is a great place to start when researching a stock so above you can see the gauge for NVC International Holdings' ROCE against it's prior returns. If you'd like to look at how NVC International Holdings has performed in the past in other metrics, you can view this free graph of NVC International Holdings' past earnings, revenue and cash flow.
How Are Returns Trending?
NVC International Holdings has broken into the black (profitability) and we're sure it's a sight for sore eyes. The company now earns 0.7% on its capital, because five years ago it was incurring losses. While returns have increased, the amount of capital employed by NVC International Holdings has remained flat over the period. So while we're happy that the business is more efficient, just keep in mind that could mean that going forward the business is lacking areas to invest internally for growth. Because in the end, a business can only get so efficient.
In another part of our analysis, we noticed that the company's ratio of current liabilities to total assets decreased to 15%, which broadly means the business is relying less on its suppliers or short-term creditors to fund its operations. So shareholders would be pleased that the growth in returns has mostly come from underlying business performance.
The Key Takeaway
As discussed above, NVC International Holdings appears to be getting more proficient at generating returns since capital employed has remained flat but earnings (before interest and tax) are up. Astute investors may have an opportunity here because the stock has declined 48% in the last five years. With that in mind, we believe the promising trends warrant this stock for further investigation.
On a separate note, we've found 1 warning sign for NVC International Holdings you'll probably want to know about.
For those who like to invest in solid companies, check out this free list of companies with solid balance sheets and high returns on equity.
Valuation is complex, but we're here to simplify it.
Discover if NVC International Holdings might be undervalued or overvalued with our detailed analysis, featuring fair value estimates, potential risks, dividends, insider trades, and its financial condition.
Access Free AnalysisHave feedback on this article? Concerned about the content? Get in touch with us directly. Alternatively, email editorial-team (at) simplywallst.com.This article by Simply Wall St is general in nature. We provide commentary based on historical data and analyst forecasts only using an unbiased methodology and our articles are not intended to be financial advice. It does not constitute a recommendation to buy or sell any stock, and does not take account of your objectives, or your financial situation. We aim to bring you long-term focused analysis driven by fundamental data. Note that our analysis may not factor in the latest price-sensitive company announcements or qualitative material. Simply Wall St has no position in any stocks mentioned.
免责声明:投资有风险,本文并非投资建议,以上内容不应被视为任何金融产品的购买或出售要约、建议或邀请,作者或其他用户的任何相关讨论、评论或帖子也不应被视为此类内容。本文仅供一般参考,不考虑您的个人投资目标、财务状况或需求。TTM对信息的准确性和完整性不承担任何责任或保证,投资者应自行研究并在投资前寻求专业建议。
热议股票
- 1
- 2
- 3
- 4
- 5
- 6
- 7
- 8
- 9
- 10