Institutional investors control 89% of Sysco Corporation (NYSE:SYY) and were rewarded last week after stock increased 3.6%
Key Insights
- Significantly high institutional ownership implies Sysco's stock price is sensitive to their trading actions
- A total of 18 investors have a majority stake in the company with 51% ownership
- Insiders have sold recently
This technology could replace computers: discover the 20 stocks are working to make quantum computing a reality.
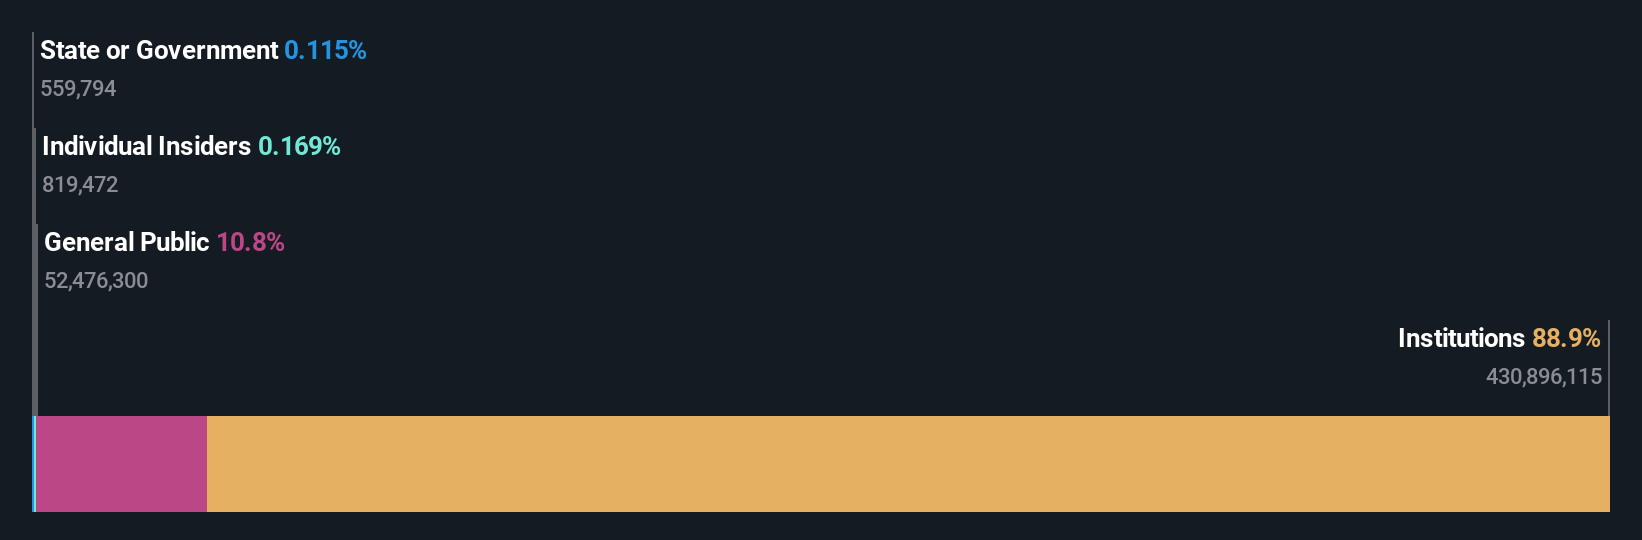
Every investor in Sysco Corporation (NYSE:SYY) should be aware of the most powerful shareholder groups. With 89% stake, institutions possess the maximum shares in the company. That is, the group stands to benefit the most if the stock rises (or lose the most if there is a downturn).
And last week, institutional investors ended up benefitting the most after the company hit US$37b in market cap. One-year return to shareholders is currently 14% and last week’s gain was the icing on the cake.
Let's delve deeper into each type of owner of Sysco, beginning with the chart below.
View our latest analysis for Sysco
What Does The Institutional Ownership Tell Us About Sysco?
Institutions typically measure themselves against a benchmark when reporting to their own investors, so they often become more enthusiastic about a stock once it's included in a major index. We would expect most companies to have some institutions on the register, especially if they are growing.
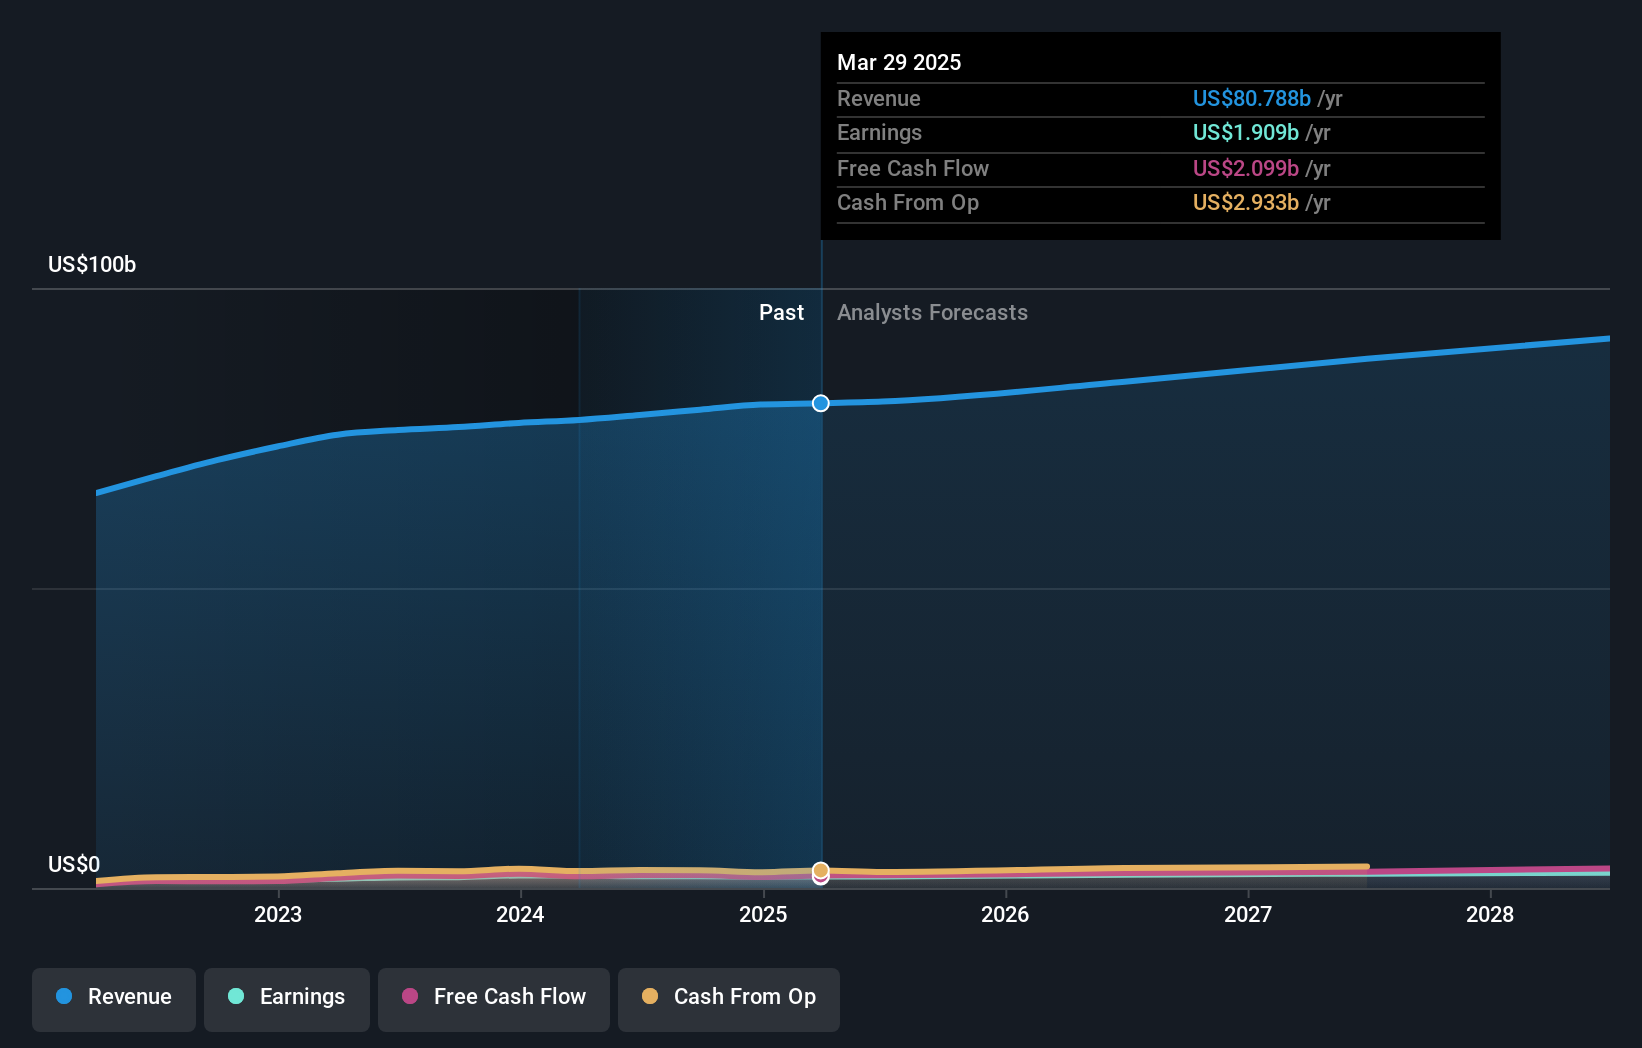
As you can see, institutional investors have a fair amount of stake in Sysco. This can indicate that the company has a certain degree of credibility in the investment community. However, it is best to be wary of relying on the supposed validation that comes with institutional investors. They too, get it wrong sometimes. It is not uncommon to see a big share price drop if two large institutional investors try to sell out of a stock at the same time. So it is worth checking the past earnings trajectory of Sysco, (below). Of course, keep in mind that there are other factors to consider, too.
Since institutional investors own more than half the issued stock, the board will likely have to pay attention to their preferences. Sysco is not owned by hedge funds. The company's largest shareholder is The Vanguard Group, Inc., with ownership of 13%. For context, the second largest shareholder holds about 7.9% of the shares outstanding, followed by an ownership of 5.5% by the third-largest shareholder.
A closer look at our ownership figures suggests that the top 18 shareholders have a combined ownership of 51% implying that no single shareholder has a majority.
While it makes sense to study institutional ownership data for a company, it also makes sense to study analyst sentiments to know which way the wind is blowing. There are a reasonable number of analysts covering the stock, so it might be useful to find out their aggregate view on the future.
Insider Ownership Of Sysco
The definition of company insiders can be subjective and does vary between jurisdictions. Our data reflects individual insiders, capturing board members at the very least. Management ultimately answers to the board. However, it is not uncommon for managers to be executive board members, especially if they are a founder or the CEO.
Most consider insider ownership a positive because it can indicate the board is well aligned with other shareholders. However, on some occasions too much power is concentrated within this group.
Our data suggests that insiders own under 1% of Sysco Corporation in their own names. It is a very large company, so it would be surprising to see insiders own a large proportion of the company. Though their holding amounts to less than 1%, we can see that board members collectively own US$63m worth of shares (at current prices). In this sort of situation, it can be more interesting to see if those insiders have been buying or selling.
General Public Ownership
The general public, who are usually individual investors, hold a 11% stake in Sysco. This size of ownership, while considerable, may not be enough to change company policy if the decision is not in sync with other large shareholders.
Next Steps:
I find it very interesting to look at who exactly owns a company. But to truly gain insight, we need to consider other information, too. Consider for instance, the ever-present spectre of investment risk. We've identified 1 warning sign with Sysco , and understanding them should be part of your investment process.
If you are like me, you may want to think about whether this company will grow or shrink. Luckily, you can check this free report showing analyst forecasts for its future.
NB: Figures in this article are calculated using data from the last twelve months, which refer to the 12-month period ending on the last date of the month the financial statement is dated. This may not be consistent with full year annual report figures.
New: Manage All Your Stock Portfolios in One Place
We've created the ultimate portfolio companion for stock investors, and it's free.
• Connect an unlimited number of Portfolios and see your total in one currency• Be alerted to new Warning Signs or Risks via email or mobile• Track the Fair Value of your stocks
Try a Demo Portfolio for FreeHave feedback on this article? Concerned about the content? Get in touch with us directly. Alternatively, email editorial-team (at) simplywallst.com.This article by Simply Wall St is general in nature. We provide commentary based on historical data and analyst forecasts only using an unbiased methodology and our articles are not intended to be financial advice. It does not constitute a recommendation to buy or sell any stock, and does not take account of your objectives, or your financial situation. We aim to bring you long-term focused analysis driven by fundamental data. Note that our analysis may not factor in the latest price-sensitive company announcements or qualitative material. Simply Wall St has no position in any stocks mentioned.
免责声明:投资有风险,本文并非投资建议,以上内容不应被视为任何金融产品的购买或出售要约、建议或邀请,作者或其他用户的任何相关讨论、评论或帖子也不应被视为此类内容。本文仅供一般参考,不考虑您的个人投资目标、财务状况或需求。TTM对信息的准确性和完整性不承担任何责任或保证,投资者应自行研究并在投资前寻求专业建议。
热议股票
- 1
- 2
- 3
- 4
- 5
- 6
- 7
- 8
- 9
- 10