Is REA Group Limited's (ASX:REA) Recent Performance Tethered To Its Attractive Financial Prospects?
REA Group's (ASX:REA) stock is up by 4.4% over the past three months. Since the market usually pay for a company’s long-term financial health, we decided to study the company’s fundamentals to see if they could be influencing the market. In this article, we decided to focus on REA Group's ROE.
Return on Equity or ROE is a test of how effectively a company is growing its value and managing investors’ money. Put another way, it reveals the company's success at turning shareholder investments into profits.
We've found 21 US stocks that are forecast to pay a dividend yield of over 6% next year. See the full list for free.
How Do You Calculate Return On Equity?
Return on equity can be calculated by using the formula:
Return on Equity = Net Profit (from continuing operations) ÷ Shareholders' Equity
So, based on the above formula, the ROE for REA Group is:
32% = AU$608m ÷ AU$1.9b (Based on the trailing twelve months to December 2024).
The 'return' refers to a company's earnings over the last year. One way to conceptualize this is that for each A$1 of shareholders' capital it has, the company made A$0.32 in profit.
View our latest analysis for REA Group
What Is The Relationship Between ROE And Earnings Growth?
Thus far, we have learned that ROE measures how efficiently a company is generating its profits. Based on how much of its profits the company chooses to reinvest or "retain", we are then able to evaluate a company's future ability to generate profits. Assuming everything else remains unchanged, the higher the ROE and profit retention, the higher the growth rate of a company compared to companies that don't necessarily bear these characteristics.
A Side By Side comparison of REA Group's Earnings Growth And 32% ROE
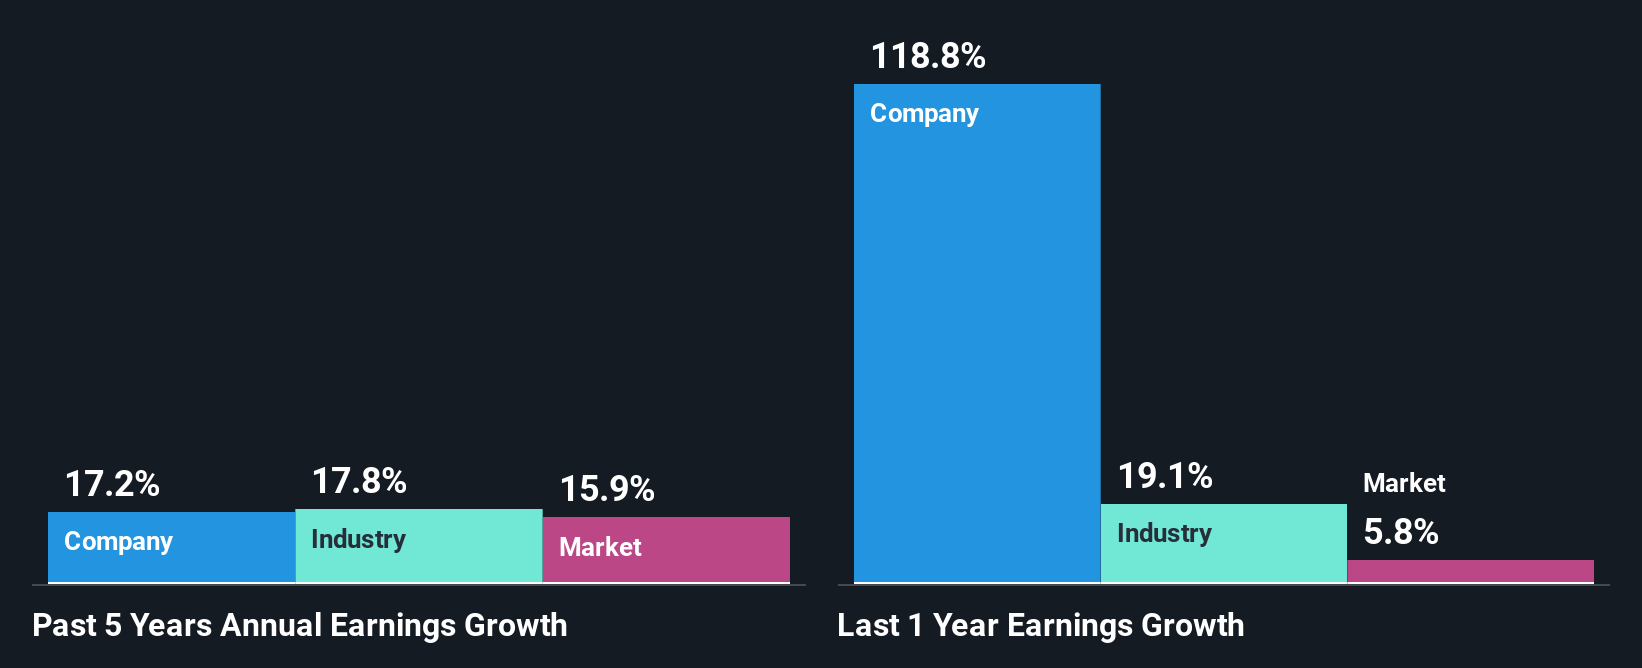
First thing first, we like that REA Group has an impressive ROE. Additionally, the company's ROE is higher compared to the industry average of 8.6% which is quite remarkable. This likely paved the way for the modest 17% net income growth seen by REA Group over the past five years.
Next, on comparing REA Group's net income growth with the industry, we found that the company's reported growth is similar to the industry average growth rate of 18% over the last few years.
The basis for attaching value to a company is, to a great extent, tied to its earnings growth. The investor should try to establish if the expected growth or decline in earnings, whichever the case may be, is priced in. Doing so will help them establish if the stock's future looks promising or ominous. One good indicator of expected earnings growth is the P/E ratio which determines the price the market is willing to pay for a stock based on its earnings prospects. So, you may want to check if REA Group is trading on a high P/E or a low P/E, relative to its industry.
Is REA Group Making Efficient Use Of Its Profits?
While REA Group has a three-year median payout ratio of 59% (which means it retains 41% of profits), the company has still seen a fair bit of earnings growth in the past, meaning that its high payout ratio hasn't hampered its ability to grow.
Moreover, REA Group is determined to keep sharing its profits with shareholders which we infer from its long history of paying a dividend for at least ten years. Our latest analyst data shows that the future payout ratio of the company over the next three years is expected to be approximately 57%. Therefore, the company's future ROE is also not expected to change by much with analysts predicting an ROE of 31%.
Summary
On the whole, we feel that REA Group's performance has been quite good. We are particularly impressed by the considerable earnings growth posted by the company, which was likely backed by its high ROE. While the company is paying out most of its earnings as dividends, it has been able to grow its earnings in spite of it, so that's probably a good sign. That being so, a study of the latest analyst forecasts show that the company is expected to see a slowdown in its future earnings growth. To know more about the company's future earnings growth forecasts take a look at this free report on analyst forecasts for the company to find out more.
New: AI Stock Screener & Alerts
Our new AI Stock Screener scans the market every day to uncover opportunities.
• Dividend Powerhouses (3%+ Yield)• Undervalued Small Caps with Insider Buying• High growth Tech and AI CompaniesOr build your own from over 50 metrics.
Explore Now for FreeHave feedback on this article? Concerned about the content? Get in touch with us directly. Alternatively, email editorial-team (at) simplywallst.com.This article by Simply Wall St is general in nature. We provide commentary based on historical data and analyst forecasts only using an unbiased methodology and our articles are not intended to be financial advice. It does not constitute a recommendation to buy or sell any stock, and does not take account of your objectives, or your financial situation. We aim to bring you long-term focused analysis driven by fundamental data. Note that our analysis may not factor in the latest price-sensitive company announcements or qualitative material. Simply Wall St has no position in any stocks mentioned.
免责声明:投资有风险,本文并非投资建议,以上内容不应被视为任何金融产品的购买或出售要约、建议或邀请,作者或其他用户的任何相关讨论、评论或帖子也不应被视为此类内容。本文仅供一般参考,不考虑您的个人投资目标、财务状况或需求。TTM对信息的准确性和完整性不承担任何责任或保证,投资者应自行研究并在投资前寻求专业建议。
热议股票
- 1
- 2
- 3
- 4
- 5
- 6
- 7
- 8
- 9
- 10