Individual investors invested in Fenbi Ltd. (HKG:2469) up 18% last week, insiders too were rewarded
Key Insights
- Significant control over Fenbi by individual investors implies that the general public has more power to influence management and governance-related decisions
- The top 7 shareholders own 53% of the company
- Insider ownership in Fenbi is 30%
AI is about to change healthcare. These 20 stocks are working on everything from early diagnostics to drug discovery. The best part - they are all under $10bn in marketcap - there is still time to get in early.
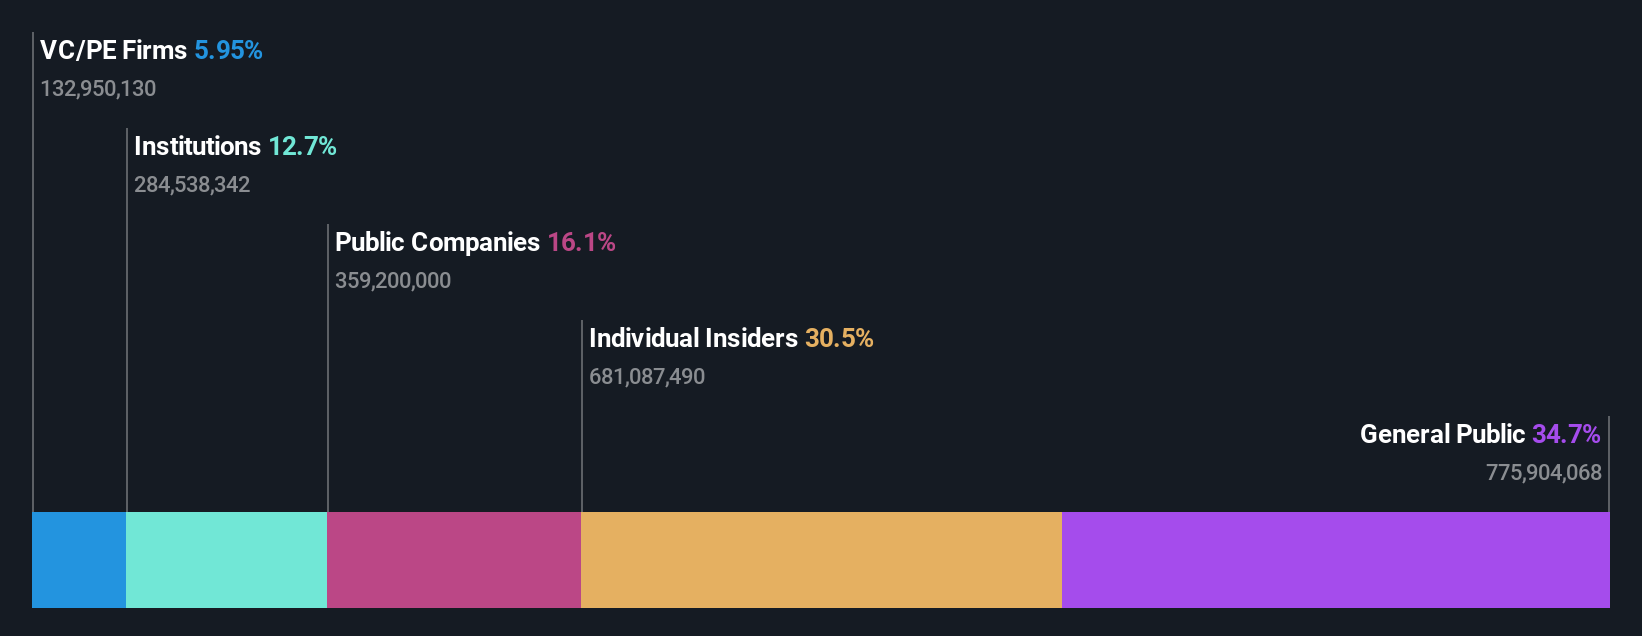
Every investor in Fenbi Ltd. (HKG:2469) should be aware of the most powerful shareholder groups. And the group that holds the biggest piece of the pie are individual investors with 35% ownership. That is, the group stands to benefit the most if the stock rises (or lose the most if there is a downturn).
Following a 18% increase in the stock price last week, individual investors profited the most, but insiders who own 30% stock also stood to gain from the increase.
In the chart below, we zoom in on the different ownership groups of Fenbi.
Check out our latest analysis for Fenbi
What Does The Institutional Ownership Tell Us About Fenbi?
Many institutions measure their performance against an index that approximates the local market. So they usually pay more attention to companies that are included in major indices.
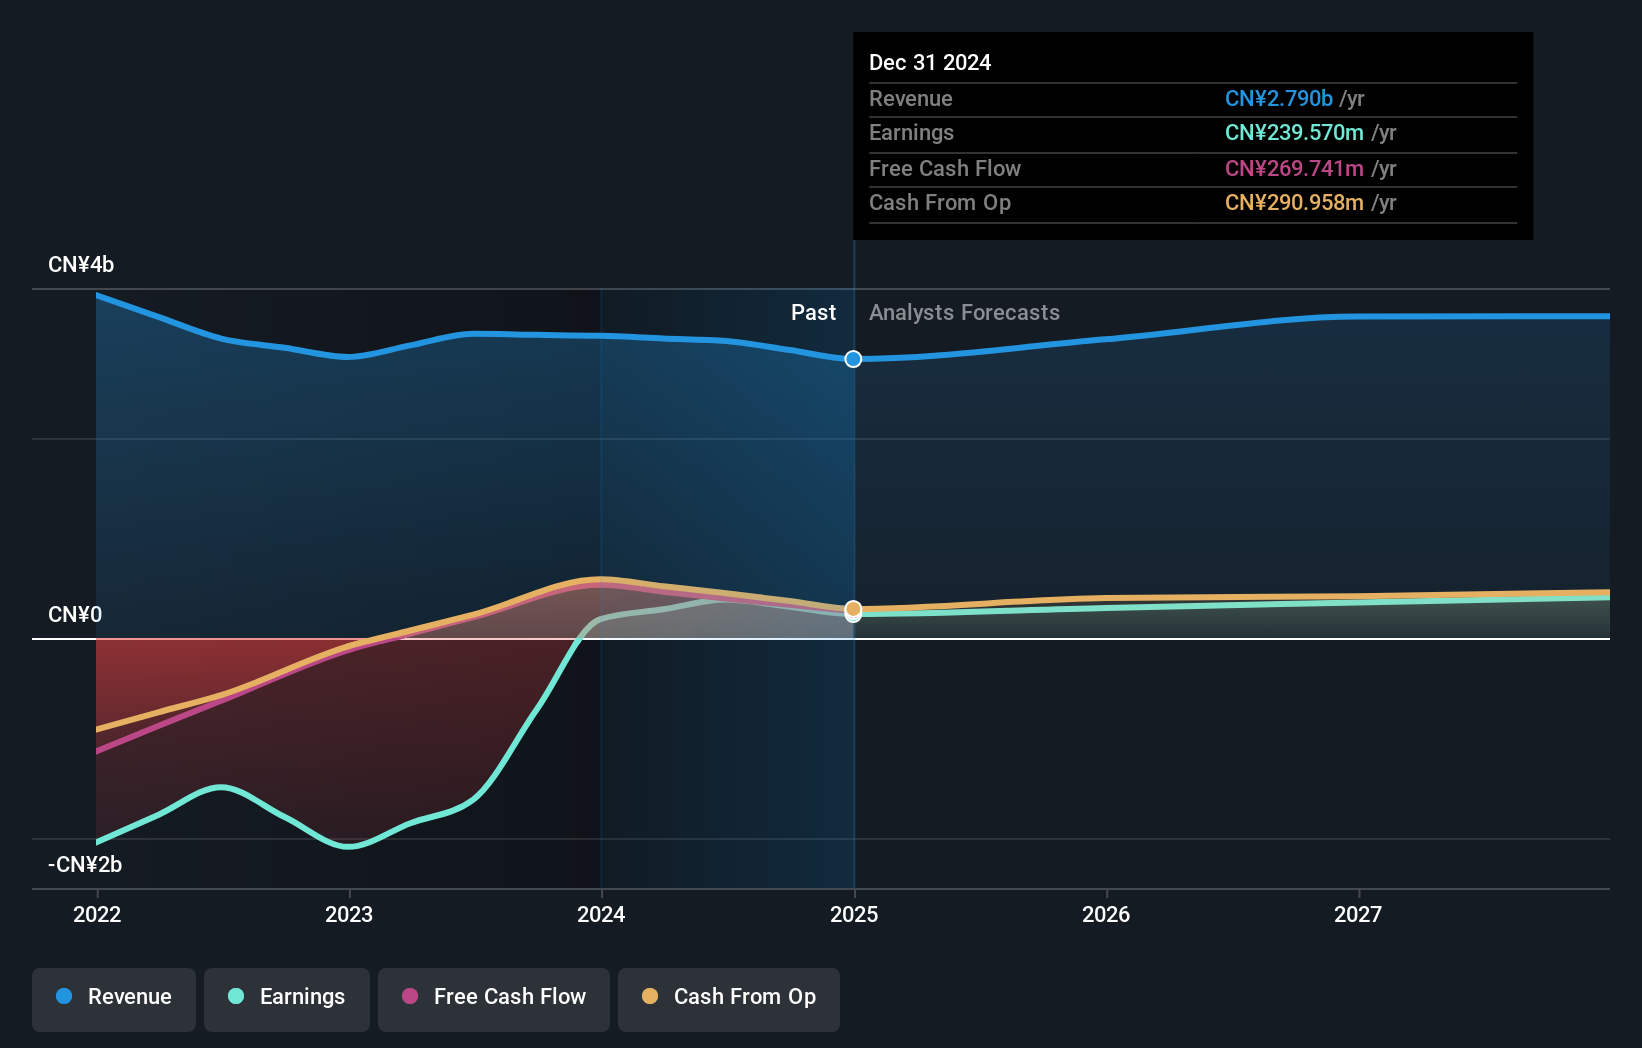
We can see that Fenbi does have institutional investors; and they hold a good portion of the company's stock. This suggests some credibility amongst professional investors. But we can't rely on that fact alone since institutions make bad investments sometimes, just like everyone does. It is not uncommon to see a big share price drop if two large institutional investors try to sell out of a stock at the same time. So it is worth checking the past earnings trajectory of Fenbi, (below). Of course, keep in mind that there are other factors to consider, too.
We note that hedge funds don't have a meaningful investment in Fenbi. The company's largest shareholder is Yong Li, with ownership of 12%. With 11% and 9.5% of the shares outstanding respectively, Tencent Holdings Limited and Xiaolong Zhang are the second and third largest shareholders. Xiaolong Zhang, who is the third-largest shareholder, also happens to hold the title of Chairman of the Board.
We also observed that the top 7 shareholders account for more than half of the share register, with a few smaller shareholders to balance the interests of the larger ones to a certain extent.
While studying institutional ownership for a company can add value to your research, it is also a good practice to research analyst recommendations to get a deeper understand of a stock's expected performance. Quite a few analysts cover the stock, so you could look into forecast growth quite easily.
Insider Ownership Of Fenbi
While the precise definition of an insider can be subjective, almost everyone considers board members to be insiders. The company management answer to the board and the latter should represent the interests of shareholders. Notably, sometimes top-level managers are on the board themselves.
Most consider insider ownership a positive because it can indicate the board is well aligned with other shareholders. However, on some occasions too much power is concentrated within this group.
Our most recent data indicates that insiders own a reasonable proportion of Fenbi Ltd.. Insiders have a HK$1.9b stake in this HK$6.3b business. This may suggest that the founders still own a lot of shares. You can click here to see if they have been buying or selling.
General Public Ownership
The general public, who are usually individual investors, hold a 35% stake in Fenbi. While this group can't necessarily call the shots, it can certainly have a real influence on how the company is run.
Private Equity Ownership
Private equity firms hold a 6.0% stake in Fenbi. This suggests they can be influential in key policy decisions. Some investors might be encouraged by this, since private equity are sometimes able to encourage strategies that help the market see the value in the company. Alternatively, those holders might be exiting the investment after taking it public.
Public Company Ownership
We can see that public companies hold 16% of the Fenbi shares on issue. We can't be certain but it is quite possible this is a strategic stake. The businesses may be similar, or work together.
Next Steps:
I find it very interesting to look at who exactly owns a company. But to truly gain insight, we need to consider other information, too.
I like to dive deeper into how a company has performed in the past. You can access this interactive graph of past earnings, revenue and cash flow, for free.
Ultimately the future is most important. You can access this free report on analyst forecasts for the company.
NB: Figures in this article are calculated using data from the last twelve months, which refer to the 12-month period ending on the last date of the month the financial statement is dated. This may not be consistent with full year annual report figures.
New: AI Stock Screener & Alerts
Our new AI Stock Screener scans the market every day to uncover opportunities.
• Dividend Powerhouses (3%+ Yield)• Undervalued Small Caps with Insider Buying• High growth Tech and AI CompaniesOr build your own from over 50 metrics.
Explore Now for FreeHave feedback on this article? Concerned about the content? Get in touch with us directly. Alternatively, email editorial-team (at) simplywallst.com.This article by Simply Wall St is general in nature. We provide commentary based on historical data and analyst forecasts only using an unbiased methodology and our articles are not intended to be financial advice. It does not constitute a recommendation to buy or sell any stock, and does not take account of your objectives, or your financial situation. We aim to bring you long-term focused analysis driven by fundamental data. Note that our analysis may not factor in the latest price-sensitive company announcements or qualitative material. Simply Wall St has no position in any stocks mentioned.
免责声明:投资有风险,本文并非投资建议,以上内容不应被视为任何金融产品的购买或出售要约、建议或邀请,作者或其他用户的任何相关讨论、评论或帖子也不应被视为此类内容。本文仅供一般参考,不考虑您的个人投资目标、财务状况或需求。TTM对信息的准确性和完整性不承担任何责任或保证,投资者应自行研究并在投资前寻求专业建议。
热议股票
- 1
- 2
- 3
- 4
- 5
- 6
- 7
- 8
- 9
- 10