Is Danaher Corporation (NYSE:DHR) Trading At A 33% Discount?
Key Insights
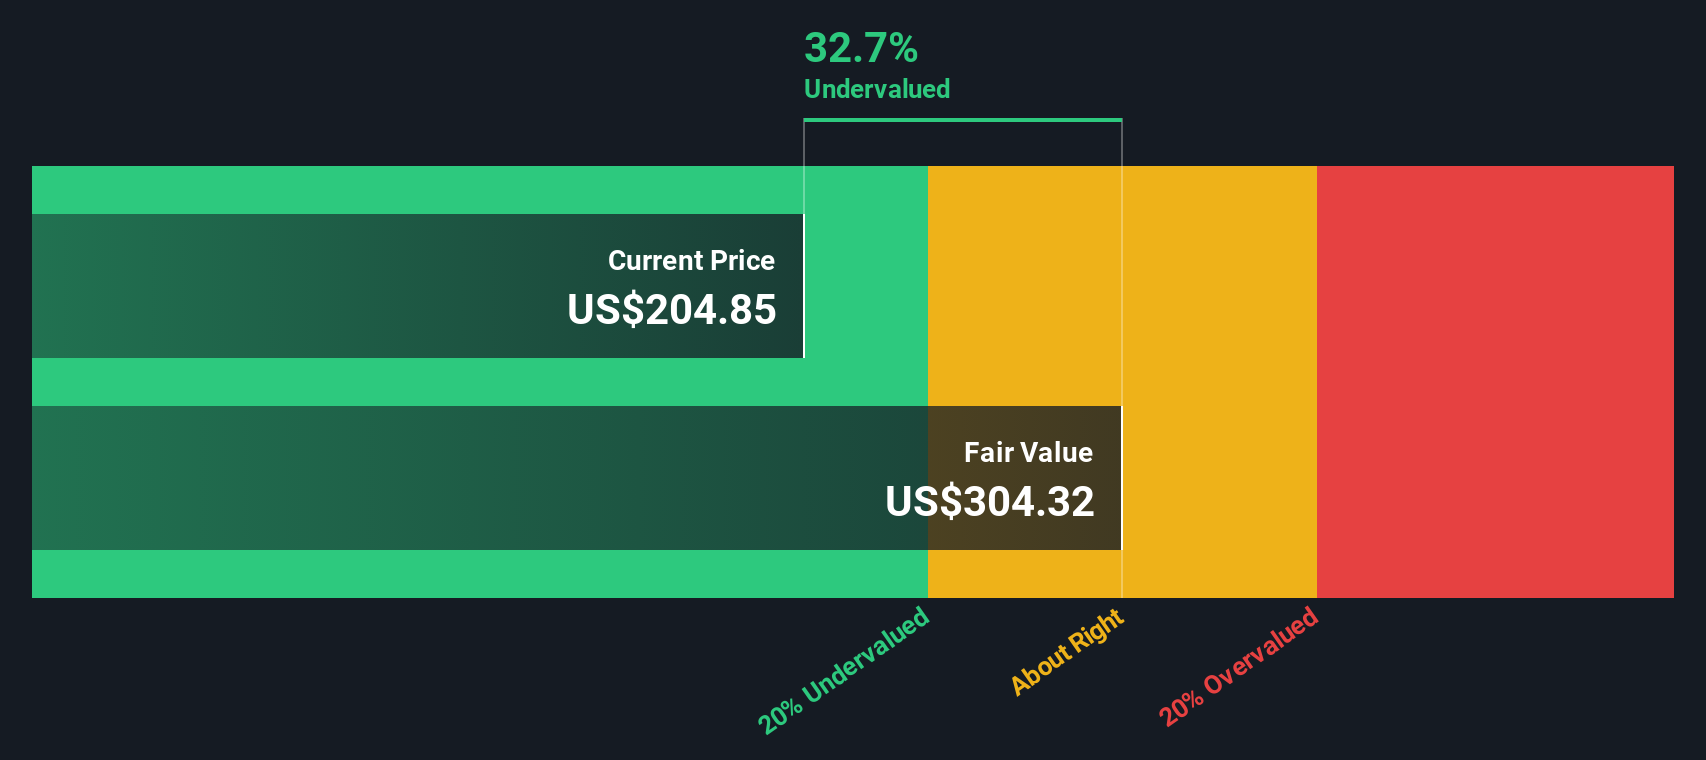
- Danaher's estimated fair value is US$304 based on 2 Stage Free Cash Flow to Equity
- Current share price of US$205 suggests Danaher is potentially 33% undervalued
- Our fair value estimate is 23% higher than Danaher's analyst price target of US$248
Today we will run through one way of estimating the intrinsic value of Danaher Corporation (NYSE:DHR) by taking the expected future cash flows and discounting them to their present value. We will take advantage of the Discounted Cash Flow (DCF) model for this purpose. Before you think you won't be able to understand it, just read on! It's actually much less complex than you'd imagine.
Remember though, that there are many ways to estimate a company's value, and a DCF is just one method. For those who are keen learners of equity analysis, the Simply Wall St analysis model here may be something of interest to you.
Trump has pledged to "unleash" American oil and gas and these 15 US stocks have developments that are poised to benefit.
Crunching The Numbers
We use what is known as a 2-stage model, which simply means we have two different periods of growth rates for the company's cash flows. Generally the first stage is higher growth, and the second stage is a lower growth phase. To start off with, we need to estimate the next ten years of cash flows. Where possible we use analyst estimates, but when these aren't available we extrapolate the previous free cash flow (FCF) from the last estimate or reported value. We assume companies with shrinking free cash flow will slow their rate of shrinkage, and that companies with growing free cash flow will see their growth rate slow, over this period. We do this to reflect that growth tends to slow more in the early years than it does in later years.
Generally we assume that a dollar today is more valuable than a dollar in the future, so we need to discount the sum of these future cash flows to arrive at a present value estimate:
10-year free cash flow (FCF) estimate
| 2026 | 2027 | 2028 | 2029 | 2030 | 2031 | 2032 | 2033 | 2034 | 2035 | |
| Levered FCF ($, Millions) | US$6.06b | US$6.70b | US$7.53b | US$8.61b | US$9.39b | US$10.1b | US$10.7b | US$11.2b | US$11.7b | US$12.2b |
| Growth Rate Estimate Source | Analyst x7 | Analyst x4 | Analyst x3 | Analyst x1 | Est @ 9.09% | Est @ 7.24% | Est @ 5.95% | Est @ 5.05% | Est @ 4.42% | Est @ 3.97% |
| Present Value ($, Millions) Discounted @ 7.0% | US$5.7k | US$5.8k | US$6.1k | US$6.6k | US$6.7k | US$6.7k | US$6.6k | US$6.5k | US$6.3k | US$6.2k |
("Est" = FCF growth rate estimated by Simply Wall St)Present Value of 10-year Cash Flow (PVCF) = US$63b
The second stage is also known as Terminal Value, this is the business's cash flow after the first stage. The Gordon Growth formula is used to calculate Terminal Value at a future annual growth rate equal to the 5-year average of the 10-year government bond yield of 2.9%. We discount the terminal cash flows to today's value at a cost of equity of 7.0%.
Terminal Value (TV)= FCF2035 × (1 + g) ÷ (r – g) = US$12b× (1 + 2.9%) ÷ (7.0%– 2.9%) = US$305b
Present Value of Terminal Value (PVTV)= TV / (1 + r)10= US$305b÷ ( 1 + 7.0%)10= US$155b
The total value is the sum of cash flows for the next ten years plus the discounted terminal value, which results in the Total Equity Value, which in this case is US$218b. In the final step we divide the equity value by the number of shares outstanding. Relative to the current share price of US$205, the company appears quite good value at a 33% discount to where the stock price trades currently. Valuations are imprecise instruments though, rather like a telescope - move a few degrees and end up in a different galaxy. Do keep this in mind.
The Assumptions
We would point out that the most important inputs to a discounted cash flow are the discount rate and of course the actual cash flows. Part of investing is coming up with your own evaluation of a company's future performance, so try the calculation yourself and check your own assumptions. The DCF also does not consider the possible cyclicality of an industry, or a company's future capital requirements, so it does not give a full picture of a company's potential performance. Given that we are looking at Danaher as potential shareholders, the cost of equity is used as the discount rate, rather than the cost of capital (or weighted average cost of capital, WACC) which accounts for debt. In this calculation we've used 7.0%, which is based on a levered beta of 0.948. Beta is a measure of a stock's volatility, compared to the market as a whole. We get our beta from the industry average beta of globally comparable companies, with an imposed limit between 0.8 and 2.0, which is a reasonable range for a stable business.
View our latest analysis for Danaher
SWOT Analysis for Danaher
- Debt is not viewed as a risk.
- Balance sheet summary for DHR.
- Earnings declined over the past year.
- Dividend is low compared to the top 25% of dividend payers in the Life Sciences market.
- Annual earnings are forecast to grow for the next 3 years.
- Trading below our estimate of fair value by more than 20%.
- Annual earnings are forecast to grow slower than the American market.
- What else are analysts forecasting for DHR?
Next Steps:
Whilst important, the DCF calculation shouldn't be the only metric you look at when researching a company. The DCF model is not a perfect stock valuation tool. Rather it should be seen as a guide to "what assumptions need to be true for this stock to be under/overvalued?" For instance, if the terminal value growth rate is adjusted slightly, it can dramatically alter the overall result. Can we work out why the company is trading at a discount to intrinsic value? For Danaher, there are three further aspects you should further examine:
- Risks: For instance, we've identified 1 warning sign for Danaher that you should be aware of.
- Future Earnings: How does DHR's growth rate compare to its peers and the wider market? Dig deeper into the analyst consensus number for the upcoming years by interacting with our free analyst growth expectation chart.
- Other High Quality Alternatives: Do you like a good all-rounder? Explore our interactive list of high quality stocks to get an idea of what else is out there you may be missing!
PS. Simply Wall St updates its DCF calculation for every American stock every day, so if you want to find the intrinsic value of any other stock just search here.
New: Manage All Your Stock Portfolios in One Place
We've created the ultimate portfolio companion for stock investors, and it's free.
• Connect an unlimited number of Portfolios and see your total in one currency• Be alerted to new Warning Signs or Risks via email or mobile• Track the Fair Value of your stocks
Try a Demo Portfolio for FreeHave feedback on this article? Concerned about the content? Get in touch with us directly. Alternatively, email editorial-team (at) simplywallst.com.This article by Simply Wall St is general in nature. We provide commentary based on historical data and analyst forecasts only using an unbiased methodology and our articles are not intended to be financial advice. It does not constitute a recommendation to buy or sell any stock, and does not take account of your objectives, or your financial situation. We aim to bring you long-term focused analysis driven by fundamental data. Note that our analysis may not factor in the latest price-sensitive company announcements or qualitative material. Simply Wall St has no position in any stocks mentioned.
免责声明:投资有风险,本文并非投资建议,以上内容不应被视为任何金融产品的购买或出售要约、建议或邀请,作者或其他用户的任何相关讨论、评论或帖子也不应被视为此类内容。本文仅供一般参考,不考虑您的个人投资目标、财务状况或需求。TTM对信息的准确性和完整性不承担任何责任或保证,投资者应自行研究并在投资前寻求专业建议。
热议股票
- 1
- 2
- 3
- 4
- 5
- 6
- 7
- 8
- 9
- 10