Wanguo Gold Group Limited's (HKG:3939) Stock Is Going Strong: Is the Market Following Fundamentals?
Most readers would already be aware that Wanguo Gold Group's (HKG:3939) stock increased significantly by 58% over the past three months. Given the company's impressive performance, we decided to study its financial indicators more closely as a company's financial health over the long-term usually dictates market outcomes. In this article, we decided to focus on Wanguo Gold Group's ROE.
ROE or return on equity is a useful tool to assess how effectively a company can generate returns on the investment it received from its shareholders. In short, ROE shows the profit each dollar generates with respect to its shareholder investments.
This technology could replace computers: discover the 20 stocks are working to make quantum computing a reality.
How To Calculate Return On Equity?
ROE can be calculated by using the formula:
Return on Equity = Net Profit (from continuing operations) ÷ Shareholders' Equity
So, based on the above formula, the ROE for Wanguo Gold Group is:
20% = CN¥691m ÷ CN¥3.5b (Based on the trailing twelve months to December 2024).
The 'return' refers to a company's earnings over the last year. So, this means that for every HK$1 of its shareholder's investments, the company generates a profit of HK$0.20.
Check out our latest analysis for Wanguo Gold Group
Why Is ROE Important For Earnings Growth?
So far, we've learned that ROE is a measure of a company's profitability. Based on how much of its profits the company chooses to reinvest or "retain", we are then able to evaluate a company's future ability to generate profits. Assuming everything else remains unchanged, the higher the ROE and profit retention, the higher the growth rate of a company compared to companies that don't necessarily bear these characteristics.
Wanguo Gold Group's Earnings Growth And 20% ROE
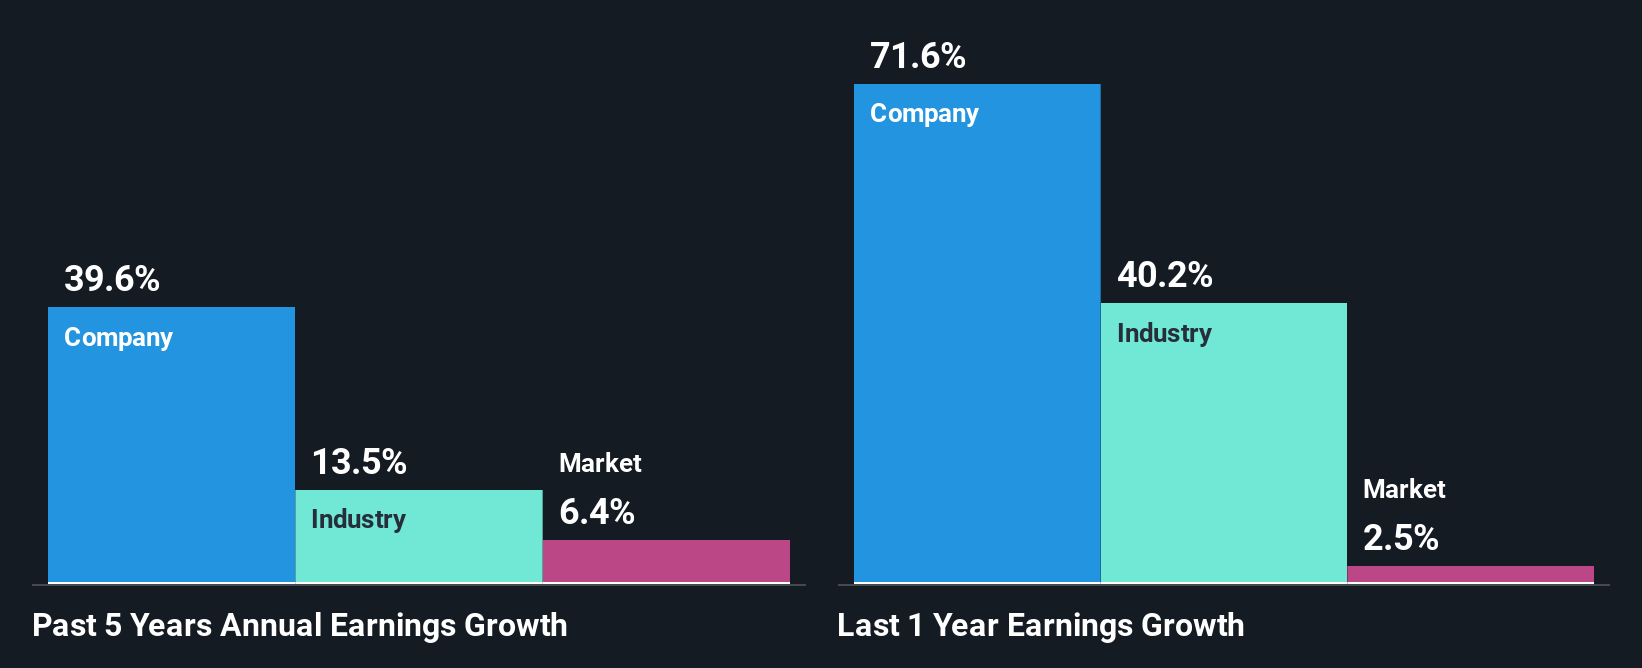
To start with, Wanguo Gold Group's ROE looks acceptable. Further, the company's ROE compares quite favorably to the industry average of 12%. Probably as a result of this, Wanguo Gold Group was able to see an impressive net income growth of 40% over the last five years. However, there could also be other causes behind this growth. For instance, the company has a low payout ratio or is being managed efficiently.
We then compared Wanguo Gold Group's net income growth with the industry and we're pleased to see that the company's growth figure is higher when compared with the industry which has a growth rate of 13% in the same 5-year period.
Earnings growth is an important metric to consider when valuing a stock. The investor should try to establish if the expected growth or decline in earnings, whichever the case may be, is priced in. This then helps them determine if the stock is placed for a bright or bleak future. Is Wanguo Gold Group fairly valued compared to other companies? These 3 valuation measures might help you decide.
Is Wanguo Gold Group Making Efficient Use Of Its Profits?
Wanguo Gold Group's three-year median payout ratio is a pretty moderate 42%, meaning the company retains 58% of its income. By the looks of it, the dividend is well covered and Wanguo Gold Group is reinvesting its profits efficiently as evidenced by its exceptional growth which we discussed above.
Moreover, Wanguo Gold Group is determined to keep sharing its profits with shareholders which we infer from its long history of paying a dividend for at least ten years.
Conclusion
Overall, we are quite pleased with Wanguo Gold Group's performance. Particularly, we like that the company is reinvesting heavily into its business, and at a high rate of return. Unsurprisingly, this has led to an impressive earnings growth. We also studied the latest analyst forecasts and found that the company's earnings growth is expected be similar to its current growth rate. Are these analysts expectations based on the broad expectations for the industry, or on the company's fundamentals? Click here to be taken to our analyst's forecasts page for the company.
Valuation is complex, but we're here to simplify it.
Discover if Wanguo Gold Group might be undervalued or overvalued with our detailed analysis, featuring fair value estimates, potential risks, dividends, insider trades, and its financial condition.
Access Free AnalysisHave feedback on this article? Concerned about the content? Get in touch with us directly. Alternatively, email editorial-team (at) simplywallst.com.This article by Simply Wall St is general in nature. We provide commentary based on historical data and analyst forecasts only using an unbiased methodology and our articles are not intended to be financial advice. It does not constitute a recommendation to buy or sell any stock, and does not take account of your objectives, or your financial situation. We aim to bring you long-term focused analysis driven by fundamental data. Note that our analysis may not factor in the latest price-sensitive company announcements or qualitative material. Simply Wall St has no position in any stocks mentioned.
免责声明:投资有风险,本文并非投资建议,以上内容不应被视为任何金融产品的购买或出售要约、建议或邀请,作者或其他用户的任何相关讨论、评论或帖子也不应被视为此类内容。本文仅供一般参考,不考虑您的个人投资目标、财务状况或需求。TTM对信息的准确性和完整性不承担任何责任或保证,投资者应自行研究并在投资前寻求专业建议。
热议股票
- 1
- 2
- 3
- 4
- 5
- 6
- 7
- 8
- 9
- 10