We Like REV Group's (NYSE:REVG) Returns And Here's How They're Trending
Finding a business that has the potential to grow substantially is not easy, but it is possible if we look at a few key financial metrics. In a perfect world, we'd like to see a company investing more capital into its business and ideally the returns earned from that capital are also increasing. Ultimately, this demonstrates that it's a business that is reinvesting profits at increasing rates of return. Speaking of which, we noticed some great changes in REV Group's (NYSE:REVG) returns on capital, so let's have a look.
This technology could replace computers: discover the 20 stocks are working to make quantum computing a reality.
Return On Capital Employed (ROCE): What Is It?
For those that aren't sure what ROCE is, it measures the amount of pre-tax profits a company can generate from the capital employed in its business. The formula for this calculation on REV Group is:
Return on Capital Employed = Earnings Before Interest and Tax (EBIT) ÷ (Total Assets - Current Liabilities)
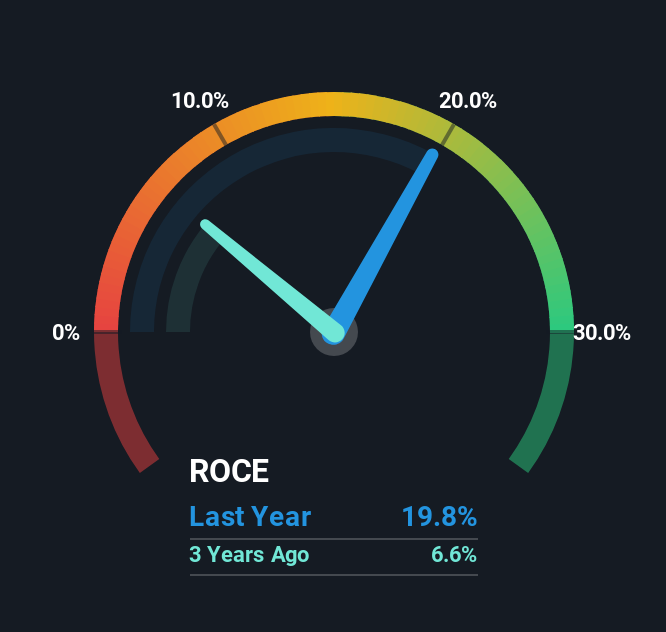
0.20 = US$144m ÷ (US$1.2b - US$500m) (Based on the trailing twelve months to April 2025).
Therefore, REV Group has an ROCE of 20%. In absolute terms that's a great return and it's even better than the Machinery industry average of 12%.
See our latest analysis for REV Group
In the above chart we have measured REV Group's prior ROCE against its prior performance, but the future is arguably more important. If you'd like to see what analysts are forecasting going forward, you should check out our free analyst report for REV Group .
What The Trend Of ROCE Can Tell Us
We're pretty happy with how the ROCE has been trending at REV Group. The figures show that over the last five years, returns on capital have grown by 2,151%. That's not bad because this tells for every dollar invested (capital employed), the company is increasing the amount earned from that dollar. In regards to capital employed, REV Group appears to been achieving more with less, since the business is using 26% less capital to run its operation. If this trend continues, the business might be getting more efficient but it's shrinking in terms of total assets.
On a separate but related note, it's important to know that REV Group has a current liabilities to total assets ratio of 41%, which we'd consider pretty high. This effectively means that suppliers (or short-term creditors) are funding a large portion of the business, so just be aware that this can introduce some elements of risk. While it's not necessarily a bad thing, it can be beneficial if this ratio is lower.
What We Can Learn From REV Group's ROCE
From what we've seen above, REV Group has managed to increase it's returns on capital all the while reducing it's capital base. Since the stock has returned a staggering 842% to shareholders over the last five years, it looks like investors are recognizing these changes. With that being said, we still think the promising fundamentals mean the company deserves some further due diligence.
One more thing, we've spotted 2 warning signs facing REV Group that you might find interesting.
REV Group is not the only stock earning high returns. If you'd like to see more, check out our free list of companies earning high returns on equity with solid fundamentals.
New: AI Stock Screener & Alerts
Our new AI Stock Screener scans the market every day to uncover opportunities.
• Dividend Powerhouses (3%+ Yield)• Undervalued Small Caps with Insider Buying• High growth Tech and AI CompaniesOr build your own from over 50 metrics.
Explore Now for FreeHave feedback on this article? Concerned about the content? Get in touch with us directly. Alternatively, email editorial-team (at) simplywallst.com.This article by Simply Wall St is general in nature. We provide commentary based on historical data and analyst forecasts only using an unbiased methodology and our articles are not intended to be financial advice. It does not constitute a recommendation to buy or sell any stock, and does not take account of your objectives, or your financial situation. We aim to bring you long-term focused analysis driven by fundamental data. Note that our analysis may not factor in the latest price-sensitive company announcements or qualitative material. Simply Wall St has no position in any stocks mentioned.
免责声明:投资有风险,本文并非投资建议,以上内容不应被视为任何金融产品的购买或出售要约、建议或邀请,作者或其他用户的任何相关讨论、评论或帖子也不应被视为此类内容。本文仅供一般参考,不考虑您的个人投资目标、财务状况或需求。TTM对信息的准确性和完整性不承担任何责任或保证,投资者应自行研究并在投资前寻求专业建议。
热议股票
- 1
- 2
- 3
- 4
- 5
- 6
- 7
- 8
- 9
- 10