Is Hologic, Inc. (NASDAQ:HOLX) Trading At A 38% Discount?
Key Insights
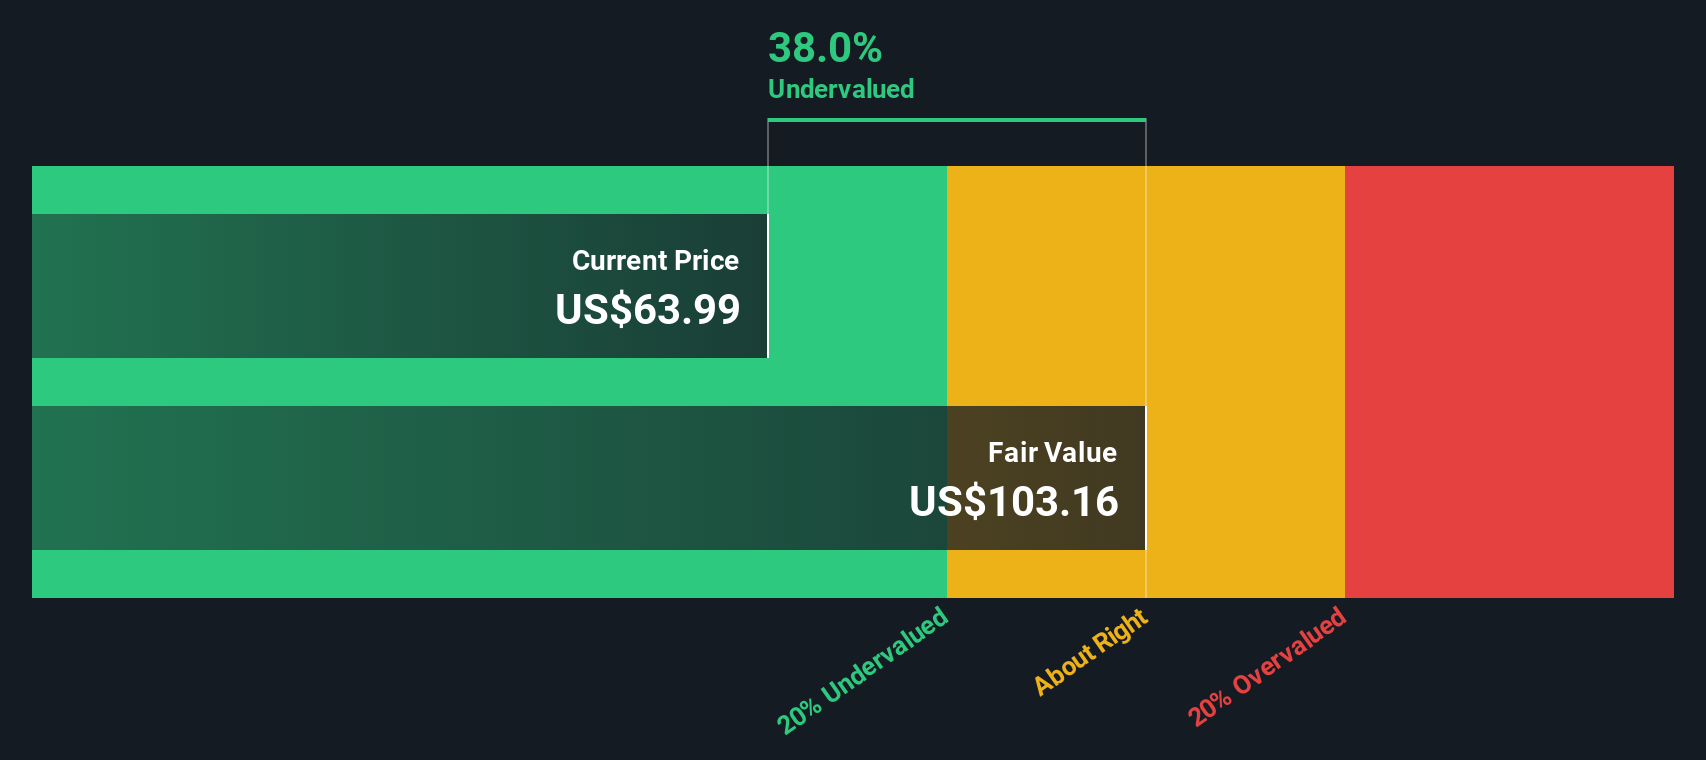
- Using the 2 Stage Free Cash Flow to Equity, Hologic fair value estimate is US$103
- Hologic is estimated to be 38% undervalued based on current share price of US$63.99
- Our fair value estimate is 48% higher than Hologic's analyst price target of US$69.74
Today we'll do a simple run through of a valuation method used to estimate the attractiveness of Hologic, Inc. (NASDAQ:HOLX) as an investment opportunity by projecting its future cash flows and then discounting them to today's value. We will use the Discounted Cash Flow (DCF) model on this occasion. Believe it or not, it's not too difficult to follow, as you'll see from our example!
We generally believe that a company's value is the present value of all of the cash it will generate in the future. However, a DCF is just one valuation metric among many, and it is not without flaws. If you still have some burning questions about this type of valuation, take a look at the Simply Wall St analysis model.
This technology could replace computers: discover the 20 stocks are working to make quantum computing a reality.
Is Hologic Fairly Valued?
We are going to use a two-stage DCF model, which, as the name states, takes into account two stages of growth. The first stage is generally a higher growth period which levels off heading towards the terminal value, captured in the second 'steady growth' period. To start off with, we need to estimate the next ten years of cash flows. Where possible we use analyst estimates, but when these aren't available we extrapolate the previous free cash flow (FCF) from the last estimate or reported value. We assume companies with shrinking free cash flow will slow their rate of shrinkage, and that companies with growing free cash flow will see their growth rate slow, over this period. We do this to reflect that growth tends to slow more in the early years than it does in later years.
A DCF is all about the idea that a dollar in the future is less valuable than a dollar today, so we need to discount the sum of these future cash flows to arrive at a present value estimate:
10-year free cash flow (FCF) estimate
| 2026 | 2027 | 2028 | 2029 | 2030 | 2031 | 2032 | 2033 | 2034 | 2035 | |
| Levered FCF ($, Millions) | US$1.04b | US$1.10b | US$1.12b | US$1.14b | US$1.17b | US$1.20b | US$1.23b | US$1.26b | US$1.30b | US$1.33b |
| Growth Rate Estimate Source | Analyst x3 | Analyst x3 | Analyst x2 | Est @ 1.93% | Est @ 2.23% | Est @ 2.45% | Est @ 2.59% | Est @ 2.70% | Est @ 2.77% | Est @ 2.82% |
| Present Value ($, Millions) Discounted @ 7.4% | US$965 | US$955 | US$904 | US$858 | US$816 | US$778 | US$743 | US$711 | US$680 | US$651 |
("Est" = FCF growth rate estimated by Simply Wall St)Present Value of 10-year Cash Flow (PVCF) = US$8.1b
The second stage is also known as Terminal Value, this is the business's cash flow after the first stage. For a number of reasons a very conservative growth rate is used that cannot exceed that of a country's GDP growth. In this case we have used the 5-year average of the 10-year government bond yield (2.9%) to estimate future growth. In the same way as with the 10-year 'growth' period, we discount future cash flows to today's value, using a cost of equity of 7.4%.
Terminal Value (TV)= FCF2035 × (1 + g) ÷ (r – g) = US$1.3b× (1 + 2.9%) ÷ (7.4%– 2.9%) = US$31b
Present Value of Terminal Value (PVTV)= TV / (1 + r)10= US$31b÷ ( 1 + 7.4%)10= US$15b
The total value is the sum of cash flows for the next ten years plus the discounted terminal value, which results in the Total Equity Value, which in this case is US$23b. To get the intrinsic value per share, we divide this by the total number of shares outstanding. Relative to the current share price of US$64.0, the company appears quite undervalued at a 38% discount to where the stock price trades currently. The assumptions in any calculation have a big impact on the valuation, so it is better to view this as a rough estimate, not precise down to the last cent.
Important Assumptions
We would point out that the most important inputs to a discounted cash flow are the discount rate and of course the actual cash flows. You don't have to agree with these inputs, I recommend redoing the calculations yourself and playing with them. The DCF also does not consider the possible cyclicality of an industry, or a company's future capital requirements, so it does not give a full picture of a company's potential performance. Given that we are looking at Hologic as potential shareholders, the cost of equity is used as the discount rate, rather than the cost of capital (or weighted average cost of capital, WACC) which accounts for debt. In this calculation we've used 7.4%, which is based on a levered beta of 1.036. Beta is a measure of a stock's volatility, compared to the market as a whole. We get our beta from the industry average beta of globally comparable companies, with an imposed limit between 0.8 and 2.0, which is a reasonable range for a stable business.
See our latest analysis for Hologic
SWOT Analysis for Hologic
- Earnings growth over the past year exceeded the industry.
- Debt is not viewed as a risk.
- Balance sheet summary for HOLX.
- No major weaknesses identified for HOLX.
- Annual earnings are forecast to grow faster than the American market.
- Good value based on P/E ratio and estimated fair value.
- Annual revenue is forecast to grow slower than the American market.
- What else are analysts forecasting for HOLX?
Moving On:
Valuation is only one side of the coin in terms of building your investment thesis, and it shouldn't be the only metric you look at when researching a company. The DCF model is not a perfect stock valuation tool. Rather it should be seen as a guide to "what assumptions need to be true for this stock to be under/overvalued?" If a company grows at a different rate, or if its cost of equity or risk free rate changes sharply, the output can look very different. Why is the intrinsic value higher than the current share price? For Hologic, there are three important items you should look at:
- Risks: As an example, we've found 1 warning sign for Hologic that you need to consider before investing here.
- Future Earnings: How does HOLX's growth rate compare to its peers and the wider market? Dig deeper into the analyst consensus number for the upcoming years by interacting with our free analyst growth expectation chart.
- Other High Quality Alternatives: Do you like a good all-rounder? Explore our interactive list of high quality stocks to get an idea of what else is out there you may be missing!
PS. Simply Wall St updates its DCF calculation for every American stock every day, so if you want to find the intrinsic value of any other stock just search here.
Valuation is complex, but we're here to simplify it.
Discover if Hologic might be undervalued or overvalued with our detailed analysis, featuring fair value estimates, potential risks, dividends, insider trades, and its financial condition.
Access Free AnalysisHave feedback on this article? Concerned about the content? Get in touch with us directly. Alternatively, email editorial-team (at) simplywallst.com.This article by Simply Wall St is general in nature. We provide commentary based on historical data and analyst forecasts only using an unbiased methodology and our articles are not intended to be financial advice. It does not constitute a recommendation to buy or sell any stock, and does not take account of your objectives, or your financial situation. We aim to bring you long-term focused analysis driven by fundamental data. Note that our analysis may not factor in the latest price-sensitive company announcements or qualitative material. Simply Wall St has no position in any stocks mentioned.
免责声明:投资有风险,本文并非投资建议,以上内容不应被视为任何金融产品的购买或出售要约、建议或邀请,作者或其他用户的任何相关讨论、评论或帖子也不应被视为此类内容。本文仅供一般参考,不考虑您的个人投资目标、财务状况或需求。TTM对信息的准确性和完整性不承担任何责任或保证,投资者应自行研究并在投资前寻求专业建议。
热议股票
- 1
- 2
- 3
- 4
- 5
- 6
- 7
- 8
- 9
- 10