Shenzhen Expressway Corporation Limited (HKG:548) Shares Could Be 22% Below Their Intrinsic Value Estimate
Key Insights
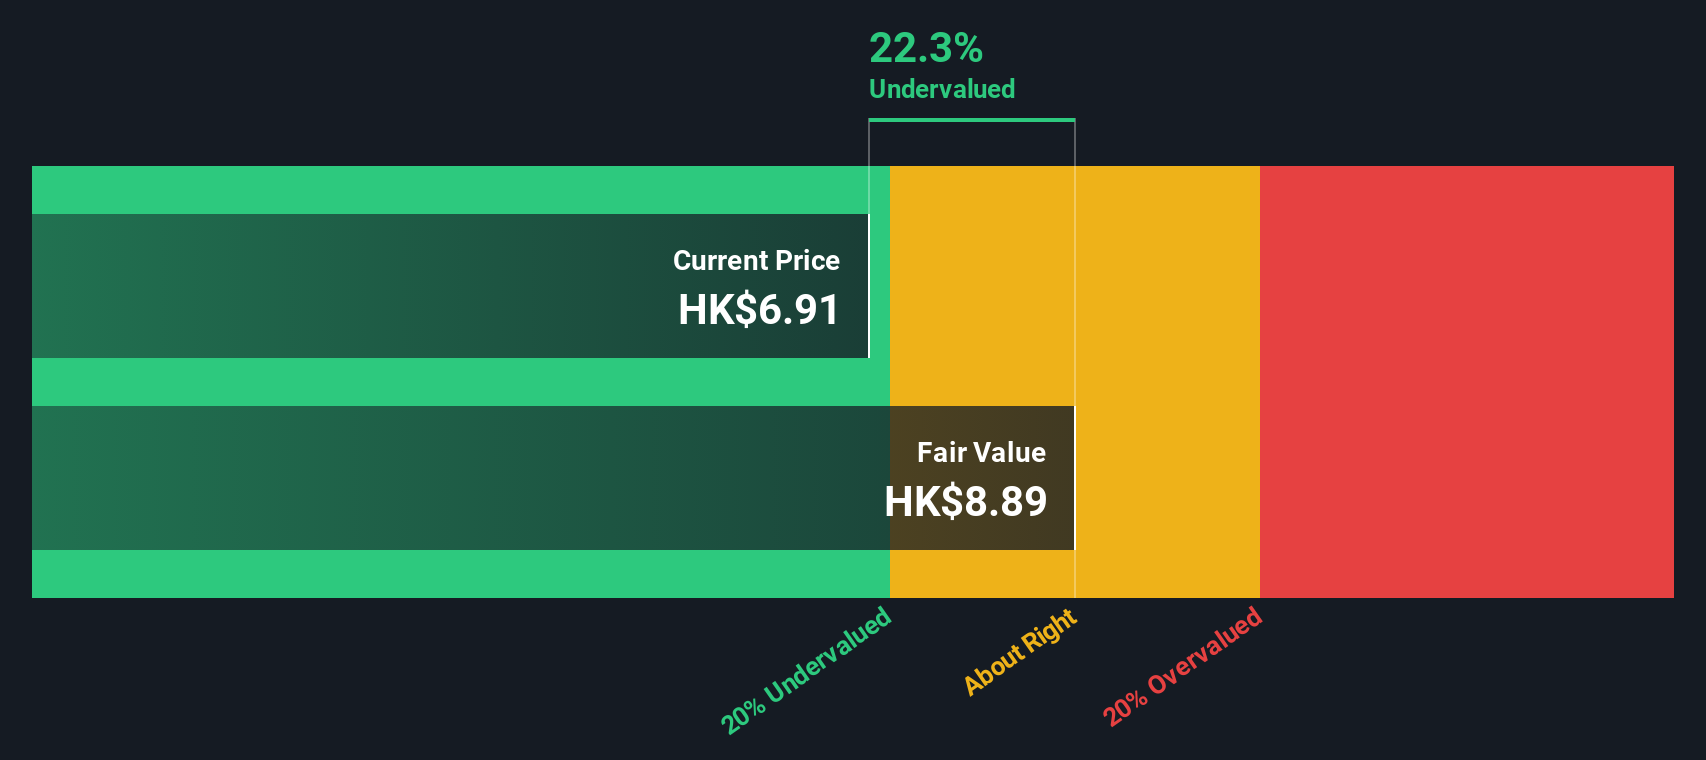
- The projected fair value for Shenzhen Expressway is HK$8.89 based on 2 Stage Free Cash Flow to Equity
- Current share price of HK$6.91 suggests Shenzhen Expressway is potentially 22% undervalued
- Our fair value estimate is 13% higher than Shenzhen Expressway's analyst price target of CN¥7.89
In this article we are going to estimate the intrinsic value of Shenzhen Expressway Corporation Limited (HKG:548) by taking the expected future cash flows and discounting them to their present value. This will be done using the Discounted Cash Flow (DCF) model. Before you think you won't be able to understand it, just read on! It's actually much less complex than you'd imagine.
We would caution that there are many ways of valuing a company and, like the DCF, each technique has advantages and disadvantages in certain scenarios. Anyone interested in learning a bit more about intrinsic value should have a read of the Simply Wall St analysis model.
This technology could replace computers: discover the 20 stocks are working to make quantum computing a reality.
Is Shenzhen Expressway Fairly Valued?
We're using the 2-stage growth model, which simply means we take in account two stages of company's growth. In the initial period the company may have a higher growth rate and the second stage is usually assumed to have a stable growth rate. To start off with, we need to estimate the next ten years of cash flows. Seeing as no analyst estimates of free cash flow are available to us, we have extrapolate the previous free cash flow (FCF) from the company's last reported value. We assume companies with shrinking free cash flow will slow their rate of shrinkage, and that companies with growing free cash flow will see their growth rate slow, over this period. We do this to reflect that growth tends to slow more in the early years than it does in later years.
Generally we assume that a dollar today is more valuable than a dollar in the future, so we need to discount the sum of these future cash flows to arrive at a present value estimate:
10-year free cash flow (FCF) estimate
| 2026 | 2027 | 2028 | 2029 | 2030 | 2031 | 2032 | 2033 | 2034 | 2035 | |
| Levered FCF (CN¥, Millions) | CN¥1.77b | CN¥1.88b | CN¥1.98b | CN¥2.06b | CN¥2.14b | CN¥2.22b | CN¥2.29b | CN¥2.36b | CN¥2.43b | CN¥2.50b |
| Growth Rate Estimate Source | Est @ 7.92% | Est @ 6.32% | Est @ 5.20% | Est @ 4.42% | Est @ 3.87% | Est @ 3.49% | Est @ 3.22% | Est @ 3.03% | Est @ 2.90% | Est @ 2.80% |
| Present Value (CN¥, Millions) Discounted @ 12% | CN¥1.6k | CN¥1.5k | CN¥1.4k | CN¥1.3k | CN¥1.2k | CN¥1.1k | CN¥1.0k | CN¥953 | CN¥876 | CN¥804 |
("Est" = FCF growth rate estimated by Simply Wall St)Present Value of 10-year Cash Flow (PVCF) = CN¥12b
After calculating the present value of future cash flows in the initial 10-year period, we need to calculate the Terminal Value, which accounts for all future cash flows beyond the first stage. The Gordon Growth formula is used to calculate Terminal Value at a future annual growth rate equal to the 5-year average of the 10-year government bond yield of 2.6%. We discount the terminal cash flows to today's value at a cost of equity of 12%.
Terminal Value (TV)= FCF2035 × (1 + g) ÷ (r – g) = CN¥2.5b× (1 + 2.6%) ÷ (12%– 2.6%) = CN¥27b
Present Value of Terminal Value (PVTV)= TV / (1 + r)10= CN¥27b÷ ( 1 + 12%)10= CN¥8.8b
The total value is the sum of cash flows for the next ten years plus the discounted terminal value, which results in the Total Equity Value, which in this case is CN¥21b. In the final step we divide the equity value by the number of shares outstanding. Compared to the current share price of HK$6.9, the company appears a touch undervalued at a 22% discount to where the stock price trades currently. Remember though, that this is just an approximate valuation, and like any complex formula - garbage in, garbage out.
The Assumptions
Now the most important inputs to a discounted cash flow are the discount rate, and of course, the actual cash flows. If you don't agree with these result, have a go at the calculation yourself and play with the assumptions. The DCF also does not consider the possible cyclicality of an industry, or a company's future capital requirements, so it does not give a full picture of a company's potential performance. Given that we are looking at Shenzhen Expressway as potential shareholders, the cost of equity is used as the discount rate, rather than the cost of capital (or weighted average cost of capital, WACC) which accounts for debt. In this calculation we've used 12%, which is based on a levered beta of 1.784. Beta is a measure of a stock's volatility, compared to the market as a whole. We get our beta from the industry average beta of globally comparable companies, with an imposed limit between 0.8 and 2.0, which is a reasonable range for a stable business.
View our latest analysis for Shenzhen Expressway
SWOT Analysis for Shenzhen Expressway
- Debt is well covered by earnings.
- Dividends are covered by earnings and cash flows.
- Dividend information for 548.
- Earnings declined over the past year.
- Dividend is low compared to the top 25% of dividend payers in the Infrastructure market.
- Shareholders have been diluted in the past year.
- Annual earnings are forecast to grow faster than the Hong Kong market.
- Trading below our estimate of fair value by more than 20%.
- Debt is not well covered by operating cash flow.
- Annual revenue is forecast to grow slower than the Hong Kong market.
- Is 548 well equipped to handle threats?
Moving On:
Although the valuation of a company is important, it ideally won't be the sole piece of analysis you scrutinize for a company. The DCF model is not a perfect stock valuation tool. Instead the best use for a DCF model is to test certain assumptions and theories to see if they would lead to the company being undervalued or overvalued. For example, changes in the company's cost of equity or the risk free rate can significantly impact the valuation. What is the reason for the share price sitting below the intrinsic value? For Shenzhen Expressway, we've put together three important items you should further examine:
- Risks: Take risks, for example - Shenzhen Expressway has 4 warning signs (and 1 which is a bit concerning) we think you should know about.
- Future Earnings: How does 548's growth rate compare to its peers and the wider market? Dig deeper into the analyst consensus number for the upcoming years by interacting with our free analyst growth expectation chart.
- Other High Quality Alternatives: Do you like a good all-rounder? Explore our interactive list of high quality stocks to get an idea of what else is out there you may be missing!
PS. The Simply Wall St app conducts a discounted cash flow valuation for every stock on the SEHK every day. If you want to find the calculation for other stocks just search here.
New: Manage All Your Stock Portfolios in One Place
We've created the ultimate portfolio companion for stock investors, and it's free.
• Connect an unlimited number of Portfolios and see your total in one currency• Be alerted to new Warning Signs or Risks via email or mobile• Track the Fair Value of your stocks
Try a Demo Portfolio for FreeHave feedback on this article? Concerned about the content? Get in touch with us directly. Alternatively, email editorial-team (at) simplywallst.com.This article by Simply Wall St is general in nature. We provide commentary based on historical data and analyst forecasts only using an unbiased methodology and our articles are not intended to be financial advice. It does not constitute a recommendation to buy or sell any stock, and does not take account of your objectives, or your financial situation. We aim to bring you long-term focused analysis driven by fundamental data. Note that our analysis may not factor in the latest price-sensitive company announcements or qualitative material. Simply Wall St has no position in any stocks mentioned.
免责声明:投资有风险,本文并非投资建议,以上内容不应被视为任何金融产品的购买或出售要约、建议或邀请,作者或其他用户的任何相关讨论、评论或帖子也不应被视为此类内容。本文仅供一般参考,不考虑您的个人投资目标、财务状况或需求。TTM对信息的准确性和完整性不承担任何责任或保证,投资者应自行研究并在投资前寻求专业建议。
热议股票
- 1
- 2
- 3
- 4
- 5
- 6
- 7
- 8
- 9
- 10