Every Solana (SOL) Holder Should Know This Level
Solana (SOL) is now testing a price level that could shape the rest of its 2025 trajectory. After climbing over 40% from its June lows, SOL is back at the $190 mark - a level that is not just technical resistance but also where the largest cluster of cost basis sits, according to new data from Glassnode.
The cost basis distribution heatmap shows that over eight million SOL was acquired between $189 and $191, making this zone one of the most heavily contested on the entire chart. It represents the last major area where buyers entered en masse before SOL broke down earlier in the year.
Now, those same positions are either at breakeven or slightly in profit - creating a possible supply wall as some look to exit.
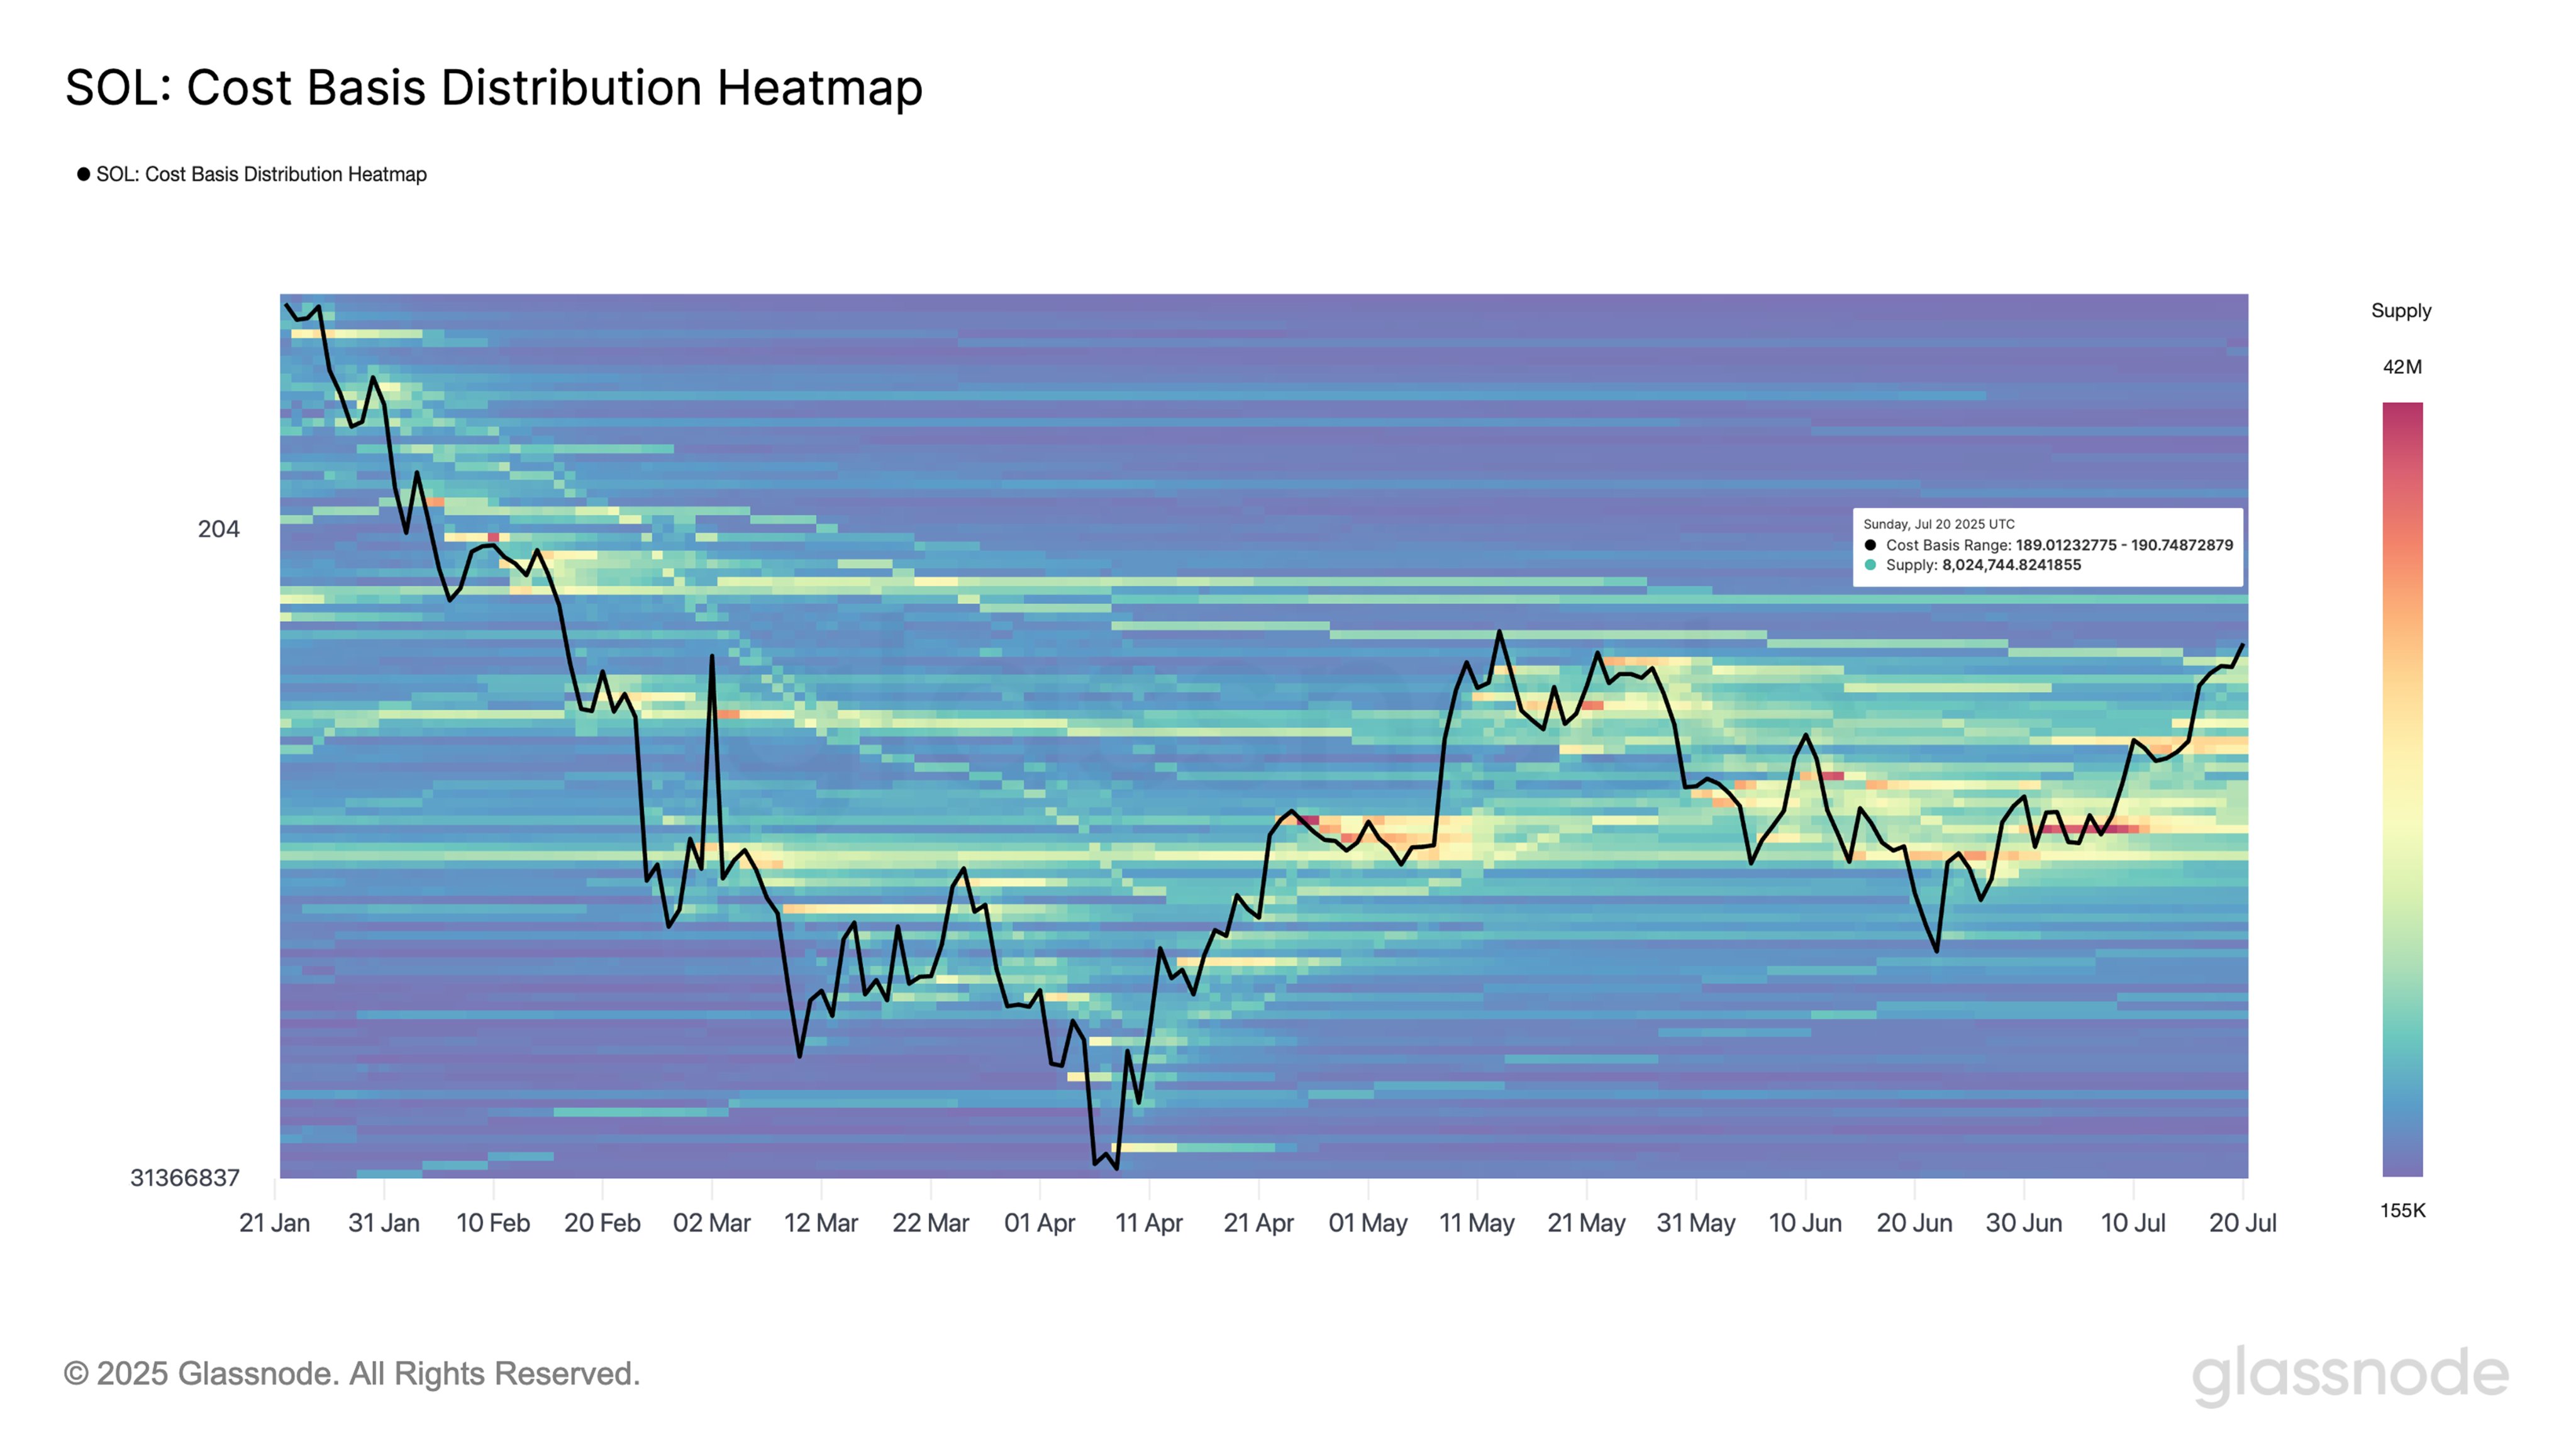
It is not all bad news. The heatmap shows a clear dip in supply density above $190. If Solana can close above this zone and hold, it might enter a stretch of thin resistance, where the price can move more quickly with fewer sell-side pressures.
The 12-hour chart is also in line with that idea. SOL has been on a clean V-shaped recovery since late June, getting back to support zones around $155 and $171 with confidence. Now, it is almost hitting the exact range shown by on-chain data - the same level that capped rallies back in February and March.
The way the historical chart resistance and cost basis data overlap makes $190 more than just another round number. It is where sentiment gets put to the test. If it breaks above, it could mean that things are turning from recovery to a full-on breakout.
But if it is rejected, it might lead to some short-term profit-taking.
免责声明:投资有风险,本文并非投资建议,以上内容不应被视为任何金融产品的购买或出售要约、建议或邀请,作者或其他用户的任何相关讨论、评论或帖子也不应被视为此类内容。本文仅供一般参考,不考虑您的个人投资目标、财务状况或需求。TTM对信息的准确性和完整性不承担任何责任或保证,投资者应自行研究并在投资前寻求专业建议。
热议股票
- 1
- 2
- 3
- 4
- 5
- 6
- 7
- 8
- 9
- 10