ASX Penny Stocks To Watch In July 2025
As the Australian market faces a slight downturn, with ASX 200 futures indicating a dip, investors are keeping a close eye on opportunities that can weather economic uncertainties. Penny stocks, despite their somewhat outdated moniker, continue to attract attention for their potential value and growth prospects. By focusing on those with solid financials and clear growth potential, investors may uncover promising opportunities among smaller or newer companies.
Top 10 Penny Stocks In Australia
| Name | Share Price | Market Cap | Rewards & Risks |
| Alfabs Australia (ASX:AAL) | A$0.39 | A$111.77M | ✅ 3 ⚠️ 3 View Analysis > |
| EZZ Life Science Holdings (ASX:EZZ) | A$2.21 | A$104.25M | ✅ 4 ⚠️ 3 View Analysis > |
| GTN (ASX:GTN) | A$0.60 | A$114.4M | ✅ 3 ⚠️ 2 View Analysis > |
| IVE Group (ASX:IGL) | A$3.00 | A$462.55M | ✅ 4 ⚠️ 2 View Analysis > |
| West African Resources (ASX:WAF) | A$2.39 | A$2.72B | ✅ 5 ⚠️ 1 View Analysis > |
| Southern Cross Electrical Engineering (ASX:SXE) | A$1.84 | A$486.51M | ✅ 4 ⚠️ 1 View Analysis > |
| Regal Partners (ASX:RPL) | A$2.66 | A$894.36M | ✅ 4 ⚠️ 2 View Analysis > |
| Navigator Global Investments (ASX:NGI) | A$1.805 | A$884.59M | ✅ 5 ⚠️ 3 View Analysis > |
| Austco Healthcare (ASX:AHC) | A$0.38 | A$138.34M | ✅ 4 ⚠️ 1 View Analysis > |
| CTI Logistics (ASX:CLX) | A$1.92 | A$154.65M | ✅ 4 ⚠️ 1 View Analysis > |
Click here to see the full list of 464 stocks from our ASX Penny Stocks screener.
We'll examine a selection from our screener results.
Conrad Asia Energy (ASX:CRD)
Simply Wall St Financial Health Rating: ★★★★★★
Overview: Conrad Asia Energy Ltd., along with its subsidiaries, focuses on oil and gas exploration and development, with a market capitalization of A$156.39 million.
Operations: Conrad Asia Energy Ltd. does not have any reported revenue segments.
Market Cap: A$156.39M
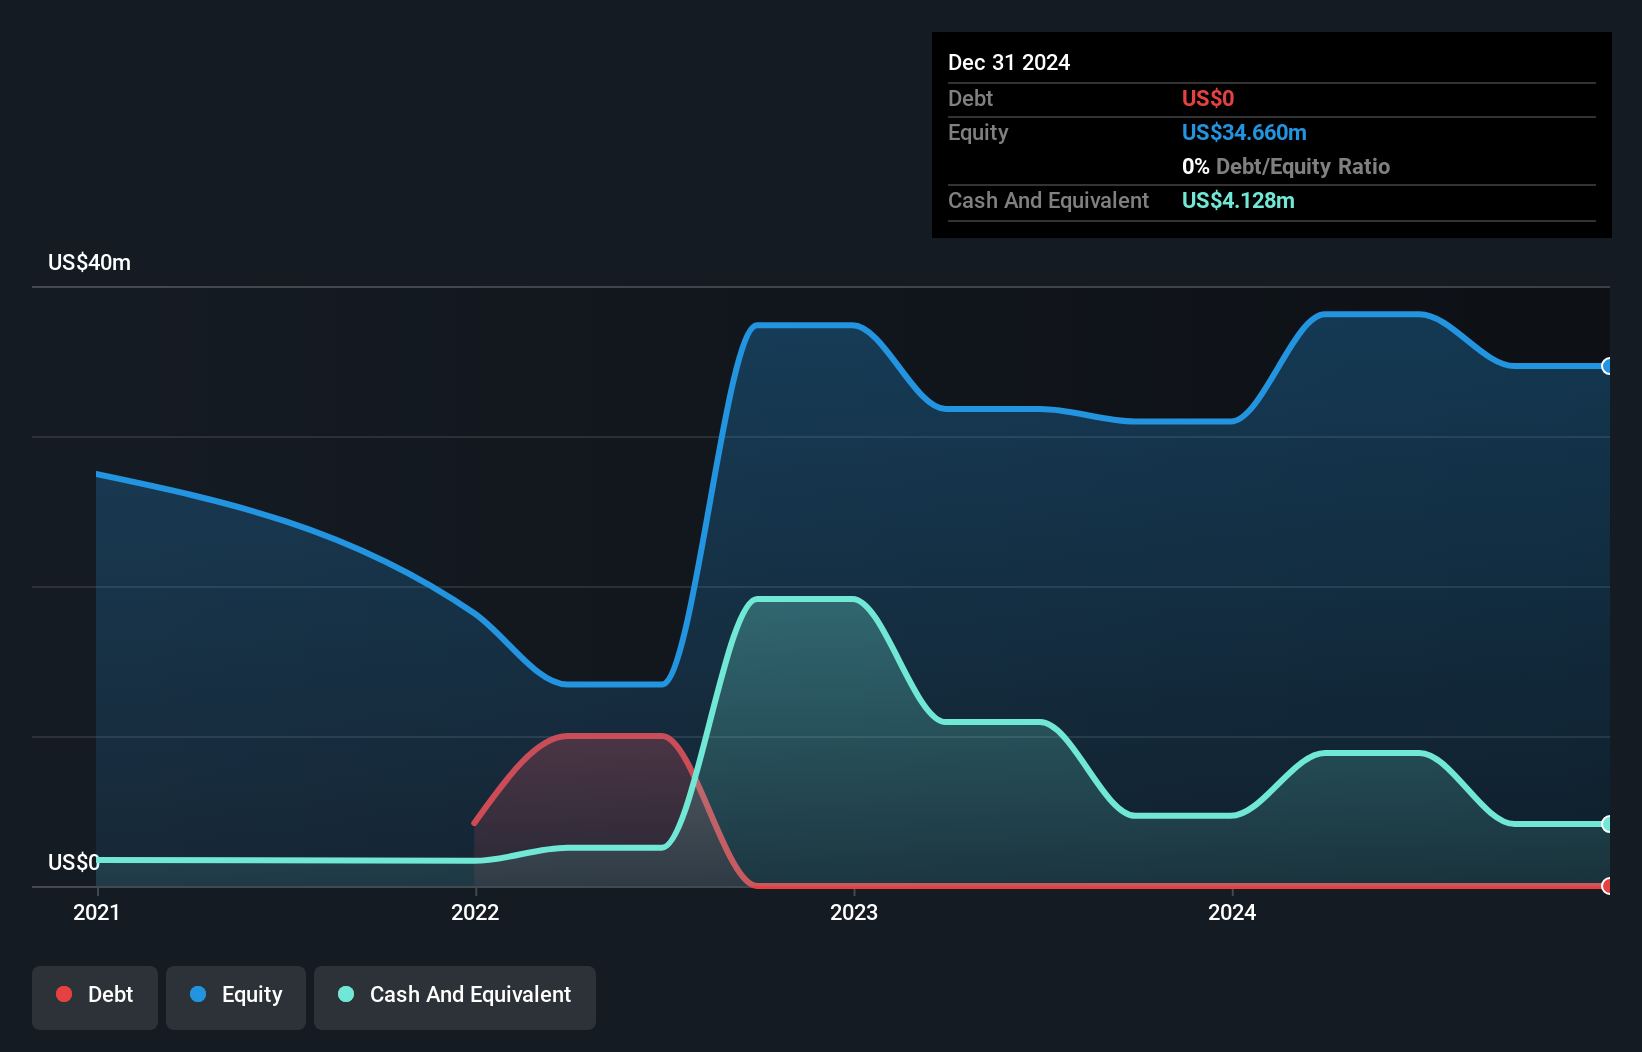
Conrad Asia Energy Ltd. recently signed a significant Gas Sales Agreement with PT PLN Energi Primer Indonesia for the Mako Gas Field, reflecting growing domestic gas demand in Indonesia. Despite being pre-revenue, the company has a market cap of A$156.39 million and is trading significantly below fair value estimates, presenting potential upside according to analysts. The company's short-term assets exceed its liabilities, and it remains debt-free. However, Conrad faces challenges as it is currently unprofitable with increasing losses over five years and limited cash runway despite recent capital raising efforts of A$9 million through equity offerings.
- Navigate through the intricacies of Conrad Asia Energy with our comprehensive balance sheet health report here.
- Evaluate Conrad Asia Energy's prospects by accessing our earnings growth report.
Silex Systems (ASX:SLX)
Simply Wall St Financial Health Rating: ★★★★★★
Overview: Silex Systems Limited is a technology commercialization company focused on the research, development, and licensing of SILEX laser enrichment technology across Australia, the United States, and the United Kingdom, with a market cap of A$1.13 billion.
Operations: The company's revenue segments include A$2.40 million from Translucent and A$7.61 million from its core operations in Silex Systems.
Market Cap: A$1.13B
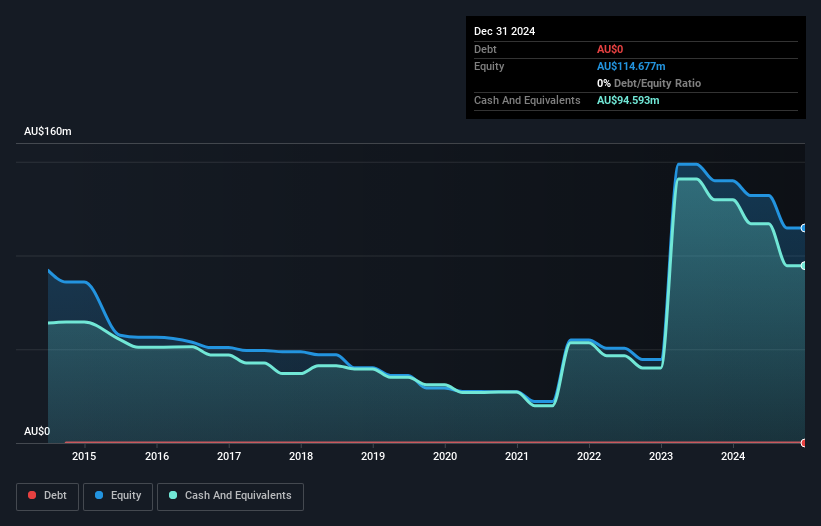
Silex Systems, with a market cap of A$1.13 billion, focuses on SILEX laser enrichment technology and remains debt-free. Despite being unprofitable with negative return on equity (-26.71%) and increasing losses over the past five years, the company maintains a stable cash runway exceeding three years due to positive free cash flow growth. The management team and board are experienced, averaging tenures of 8.7 and 20 years respectively. While short-term assets (A$106.5M) comfortably cover liabilities, share price volatility persists alongside high weekly volatility compared to most Australian stocks.
- Click to explore a detailed breakdown of our findings in Silex Systems' financial health report.
- Gain insights into Silex Systems' outlook and expected performance with our report on the company's earnings estimates.
XRF Scientific (ASX:XRF)
Simply Wall St Financial Health Rating: ★★★★★★
Overview: XRF Scientific Limited manufactures and markets precious metal products, specialized chemicals, and instruments for the scientific, analytical, construction material, and mining industries across Australia, Canada, and Europe with a market cap of A$295.13 million.
Operations: XRF Scientific generates revenue from three main segments: Consumables (A$18.86 million), Precious Metals (A$21.48 million), and Capital Equipment (A$22.20 million).
Market Cap: A$295.13M
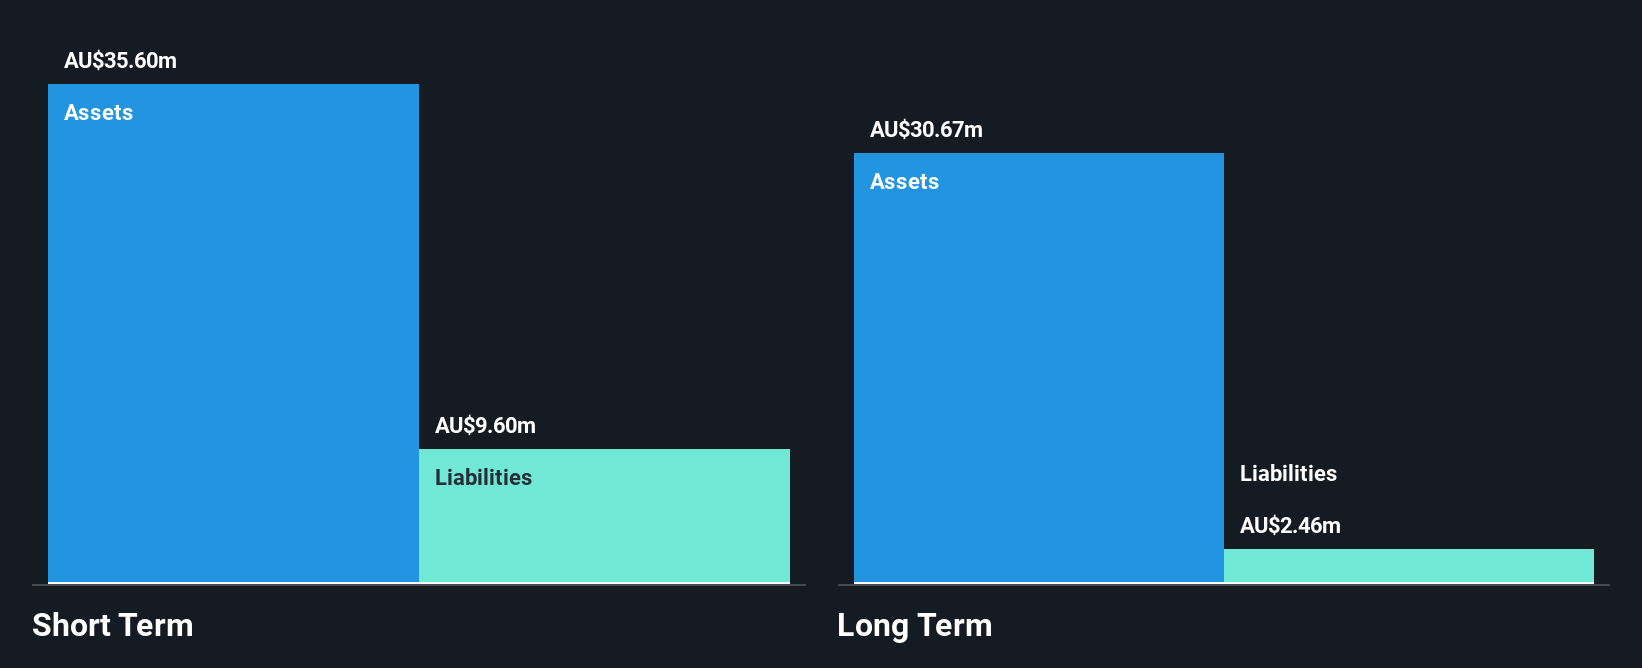
XRF Scientific, with a market cap of A$295.13 million, demonstrates strong financial health as its short-term assets (A$35.6M) surpass both short-term (A$9.6M) and long-term liabilities (A$2.5M). The company's debt management is robust, with a reduced debt-to-equity ratio from 13.2% to 4.7% over five years and more cash than total debt, ensuring interest payments are well-covered by EBIT (58.8x). Despite low return on equity at 18.1%, earnings have grown significantly by 22.8% annually over the past five years, supported by high-quality earnings and stable weekly volatility at 5%. However, recent delisting from OTC Equity due to inactivity may impact investor sentiment.
- Click here to discover the nuances of XRF Scientific with our detailed analytical financial health report.
- Explore XRF Scientific's analyst forecasts in our growth report.
Taking Advantage
- Explore the 464 names from our ASX Penny Stocks screener here.
- Interested In Other Possibilities? Find companies with promising cash flow potential yet trading below their fair value.
This article by Simply Wall St is general in nature. We provide commentary based on historical data and analyst forecasts only using an unbiased methodology and our articles are not intended to be financial advice. It does not constitute a recommendation to buy or sell any stock, and does not take account of your objectives, or your financial situation. We aim to bring you long-term focused analysis driven by fundamental data. Note that our analysis may not factor in the latest price-sensitive company announcements or qualitative material. Simply Wall St has no position in any stocks mentioned.
New: AI Stock Screener & Alerts
Our new AI Stock Screener scans the market every day to uncover opportunities.
• Dividend Powerhouses (3%+ Yield)• Undervalued Small Caps with Insider Buying• High growth Tech and AI CompaniesOr build your own from over 50 metrics.
Explore Now for FreeHave feedback on this article? Concerned about the content? Get in touch with us directly. Alternatively, email editorial-team@simplywallst.com
免责声明:投资有风险,本文并非投资建议,以上内容不应被视为任何金融产品的购买或出售要约、建议或邀请,作者或其他用户的任何相关讨论、评论或帖子也不应被视为此类内容。本文仅供一般参考,不考虑您的个人投资目标、财务状况或需求。TTM对信息的准确性和完整性不承担任何责任或保证,投资者应自行研究并在投资前寻求专业建议。
热议股票
- 1
- 2
- 3
- 4
- 5
- 6
- 7
- 8
- 9
- 10