Undiscovered Gems in the US Market for July 2025
As the U.S. market reaches new heights with the S&P 500 and Nasdaq Composite hitting record levels, investors are keenly observing trade developments and corporate earnings, especially in a week packed with major announcements. Amid this backdrop of economic strength and easing tariff concerns, the search for undiscovered gems becomes even more pertinent as investors look for opportunities that align with current market dynamics. Identifying promising stocks often involves finding companies that can thrive under evolving trade agreements and demonstrate resilience in their financial performance.
Top 10 Undiscovered Gems With Strong Fundamentals In The United States
| Name | Debt To Equity | Revenue Growth | Earnings Growth | Health Rating |
|---|---|---|---|---|
| Southern Michigan Bancorp | 117.38% | 8.87% | 4.89% | ★★★★★★ |
| Wilson Bank Holding | 0.00% | 7.88% | 8.09% | ★★★★★★ |
| Metalpha Technology Holding | NA | 81.88% | -4.97% | ★★★★★★ |
| FRMO | 0.09% | 44.64% | 49.91% | ★★★★★☆ |
| Valhi | 43.01% | 1.55% | -2.64% | ★★★★★☆ |
| China SXT Pharmaceuticals | 64.25% | -29.05% | 10.33% | ★★★★★☆ |
| Pure Cycle | 5.02% | 4.35% | -2.25% | ★★★★★☆ |
| Rich Sparkle Holdings | 26.73% | -6.13% | 1.75% | ★★★★★☆ |
| Reitar Logtech Holdings | 31.39% | 231.46% | 41.38% | ★★★★☆☆ |
| Vantage | 6.72% | -16.62% | -15.47% | ★★★★☆☆ |
Click here to see the full list of 294 stocks from our US Undiscovered Gems With Strong Fundamentals screener.
Here's a peek at a few of the choices from the screener.
Daily Journal (DJCO)
Simply Wall St Value Rating: ★★★★★★
Overview: Daily Journal Corporation operates by publishing newspapers and websites in California, Arizona, Utah, and Australia, with a market cap of $564.06 million.
Operations: Daily Journal Corporation generates revenue primarily from its Journal Technologies segment, contributing $55.95 million, and its Traditional Business segment, adding $17.30 million. The company has a market cap of approximately $564.06 million.
Daily Journal has seen a remarkable earnings surge of 375%, outpacing the software industry's 18.7% growth, likely bolstered by a significant $134.5 million one-off gain in the last year. This small company maintains a solid financial footing with more cash than total debt and has reduced its debt-to-equity ratio from 32.7% to 7.8% over five years, showcasing prudent financial management. Its price-to-earnings ratio of 5.3x suggests it could be undervalued compared to the broader US market's 18.7x, despite recent delays in SEC filings which may raise some eyebrows among investors.
- Click here to discover the nuances of Daily Journal with our detailed analytical health report.
Review our historical performance report to gain insights into Daily Journal's's past performance.
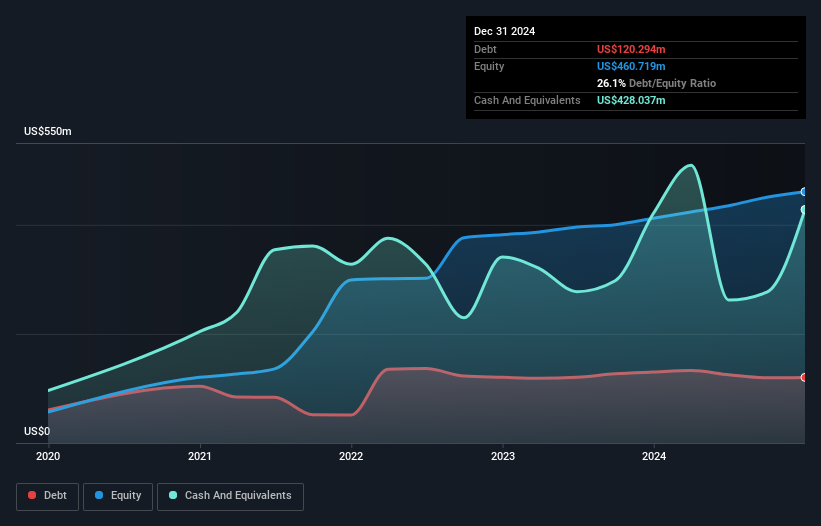
Third Coast Bancshares (TCBX)
Simply Wall St Value Rating: ★★★★★★
Overview: Third Coast Bancshares, Inc. is the bank holding company for Third Coast Bank, offering a range of commercial banking solutions to small and medium-sized businesses and professionals in the United States, with a market cap of $506.97 million.
Operations: Third Coast Bancshares generates revenue primarily from its community banking segment, amounting to $182.32 million.
Third Coast Bancshares, with assets totaling US$4.9 billion and equity of US$496.1 million, is making waves with its strategic focus on loan securitization aimed at enhancing balance sheet flexibility. The bank's robust allowance for bad loans stands at 199%, while 96% of liabilities come from low-risk funding sources like customer deposits, ensuring stability. Earnings surged by 64% last year, outpacing industry growth significantly. Despite trading below estimated fair value by nearly 30%, challenges such as rising noninterest expenses and regional concentration could impact future performance. Recent net income for Q2 reached US$16.75 million compared to last year's US$10.8 million, reflecting strong operational progress amidst these hurdles.
- Third Coast Bancshares' strategic loan securitization enhances balance sheet flexibility and earnings. Click here to explore the full narrative on the company's investment potential.
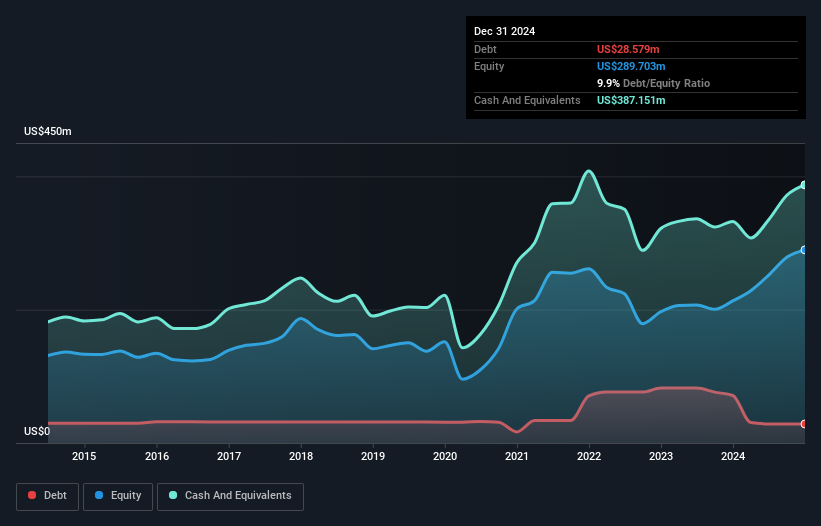
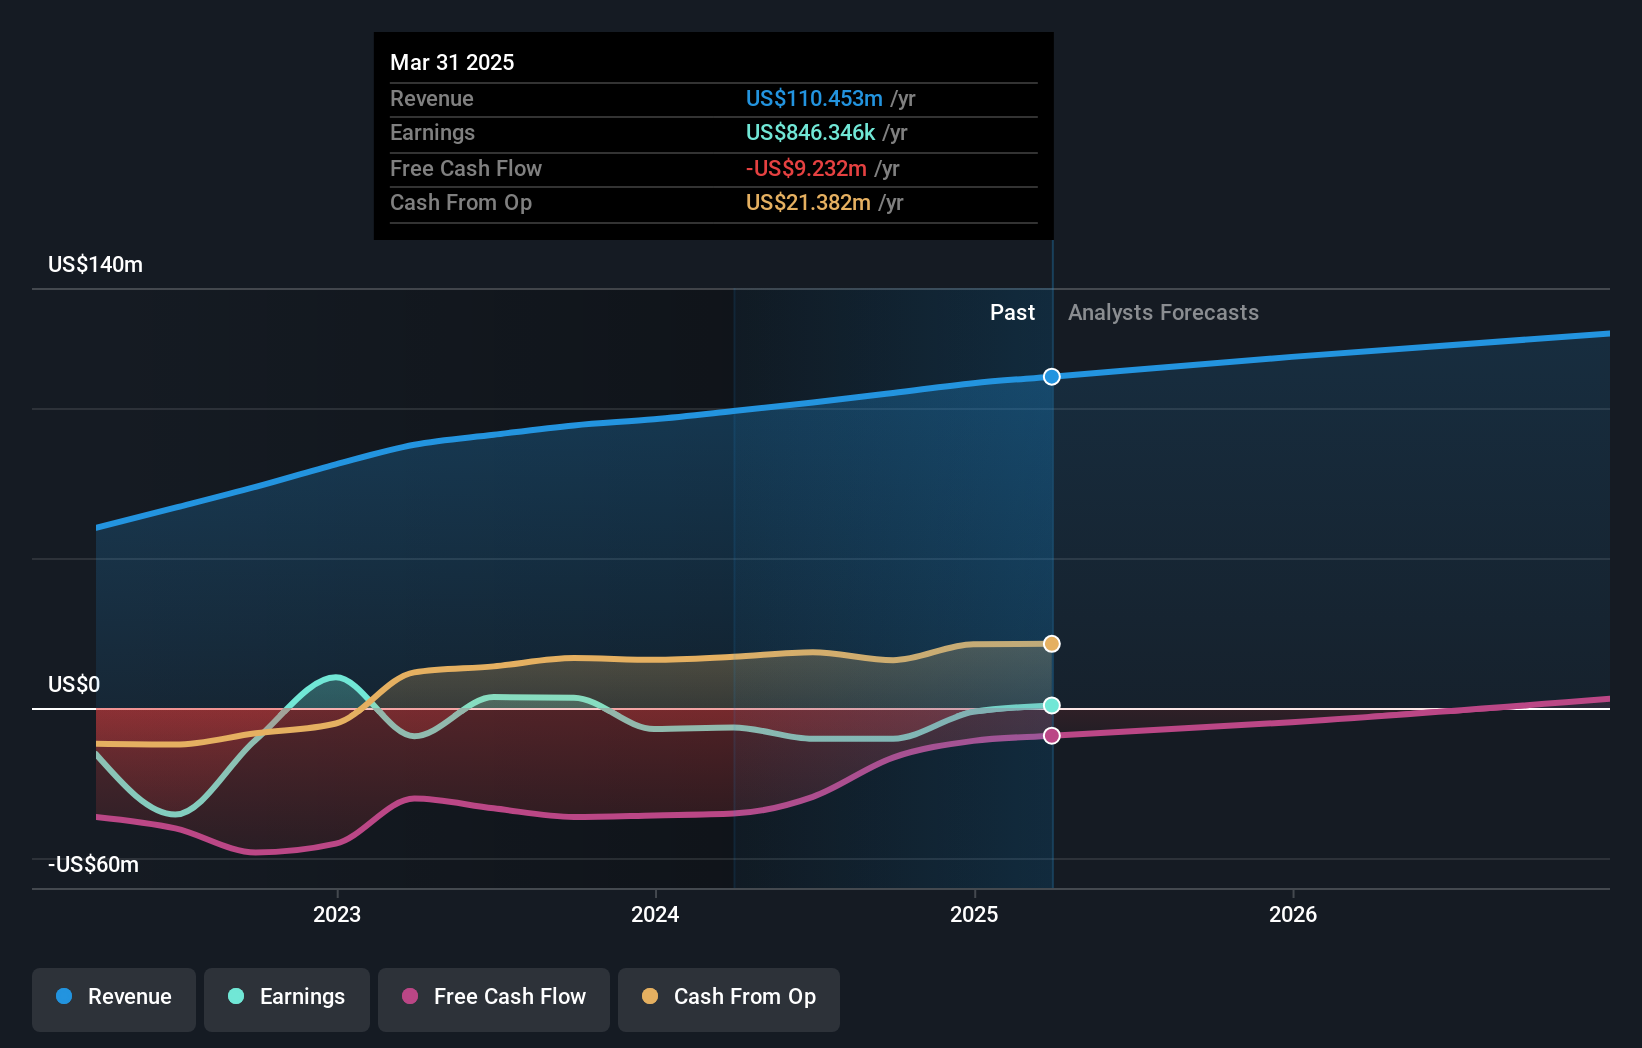
Boston Omaha (BOC)
Simply Wall St Value Rating: ★★★★☆☆
Overview: Boston Omaha Corporation, with a market cap of $433.11 million, operates in the outdoor billboard advertising industry in the southeast United States through its subsidiaries.
Operations: Boston Omaha's revenue streams are primarily driven by Link Media Holdings, LLC at $45.22 million and Boston Omaha Broadband, LLC at $39.73 million. The company's operations also include General Indemnity Group, LLC contributing $25.44 million in revenue and a smaller segment from Boston Omaha Asset Management with $0.05 million.
Boston Omaha, a smaller player in the market, has recently turned profitable, with its revenue reaching US$27.73 million for Q1 2025 compared to US$25.55 million in the previous year. The company reported a net loss of US$0.67 million, an improvement from last year's US$2.81 million loss. Over five years, its debt-to-equity ratio rose from 5.6% to 7.6%, indicating increased leverage but manageable given that cash exceeds total debt levels. Despite no shares repurchased this year so far, Boston Omaha completed buying back 111,323 shares for US$1.59 million under its ongoing buyback program announced last July.
- Dive into the specifics of Boston Omaha here with our thorough health report.
Understand Boston Omaha's track record by examining our Past report.
Seize The Opportunity
- Click here to access our complete index of 294 US Undiscovered Gems With Strong Fundamentals.
- Have a stake in these businesses? Integrate your holdings into Simply Wall St's portfolio for notifications and detailed stock reports.
- Discover a world of investment opportunities with Simply Wall St's free app and access unparalleled stock analysis across all markets.
Seeking Other Investments?
- Explore high-performing small cap companies that haven't yet garnered significant analyst attention.
- Fuel your portfolio with companies showing strong growth potential, backed by optimistic outlooks both from analysts and management.
- Find companies with promising cash flow potential yet trading below their fair value.
This article by Simply Wall St is general in nature. We provide commentary based on historical data and analyst forecasts only using an unbiased methodology and our articles are not intended to be financial advice. It does not constitute a recommendation to buy or sell any stock, and does not take account of your objectives, or your financial situation. We aim to bring you long-term focused analysis driven by fundamental data. Note that our analysis may not factor in the latest price-sensitive company announcements or qualitative material. Simply Wall St has no position in any stocks mentioned.
Valuation is complex, but we're here to simplify it.
Discover if Boston Omaha might be undervalued or overvalued with our detailed analysis, featuring fair value estimates, potential risks, dividends, insider trades, and its financial condition.
Access Free AnalysisHave feedback on this article? Concerned about the content? Get in touch with us directly. Alternatively, email editorial-team@simplywallst.com
免责声明:投资有风险,本文并非投资建议,以上内容不应被视为任何金融产品的购买或出售要约、建议或邀请,作者或其他用户的任何相关讨论、评论或帖子也不应被视为此类内容。本文仅供一般参考,不考虑您的个人投资目标、财务状况或需求。TTM对信息的准确性和完整性不承担任何责任或保证,投资者应自行研究并在投资前寻求专业建议。
热议股票
- 1
- 2
- 3
- 4
- 5
- 6
- 7
- 8
- 9
- 10