TradingKey - Last Friday, the U.S. Labor Department sharply revised downward its May and June nonfarm payroll figures by a combined 258,000 jobs, a reduction exceeding 90%. Meanwhile, July’s payroll increase came in at just 73,000, falling short of the 100,000 forecast.
.jpg)
Data Sources: Bureau of Labor Statistics, TradingKey As of: August 7, 2025
At the same time, President Trump claimed the employment data had been “manipulated” and fired the Bureau of Labor Statistics director. Although this move drew broad criticism from Wall Street, it gained support from Ray Dalio, founder of Bridgewater Associates, who argued that current statistical methods have flaws and that the revisions bring the data closer to independent estimates.
The stock market plunged immediately after the announcement. Market expectations for a Federal Reserve rate cut in September surged from roughly 20% to above 90%, with some investors even considering the possibility of a one-time 50 bps reduction. In recent meetings, Fed Chair Jerome Powell resisted cutting rates, citing tariff-related inflation uncertainties and the labor market’s sustained strength as key justification.
However, the unprecedented scale of these downward revisions not only defies historical precedent but also makes the Fed’s recent reluctance to ease appear shortsighted, fueling Trump’s frequent taunts branding Powell as “Too Late” Powell.
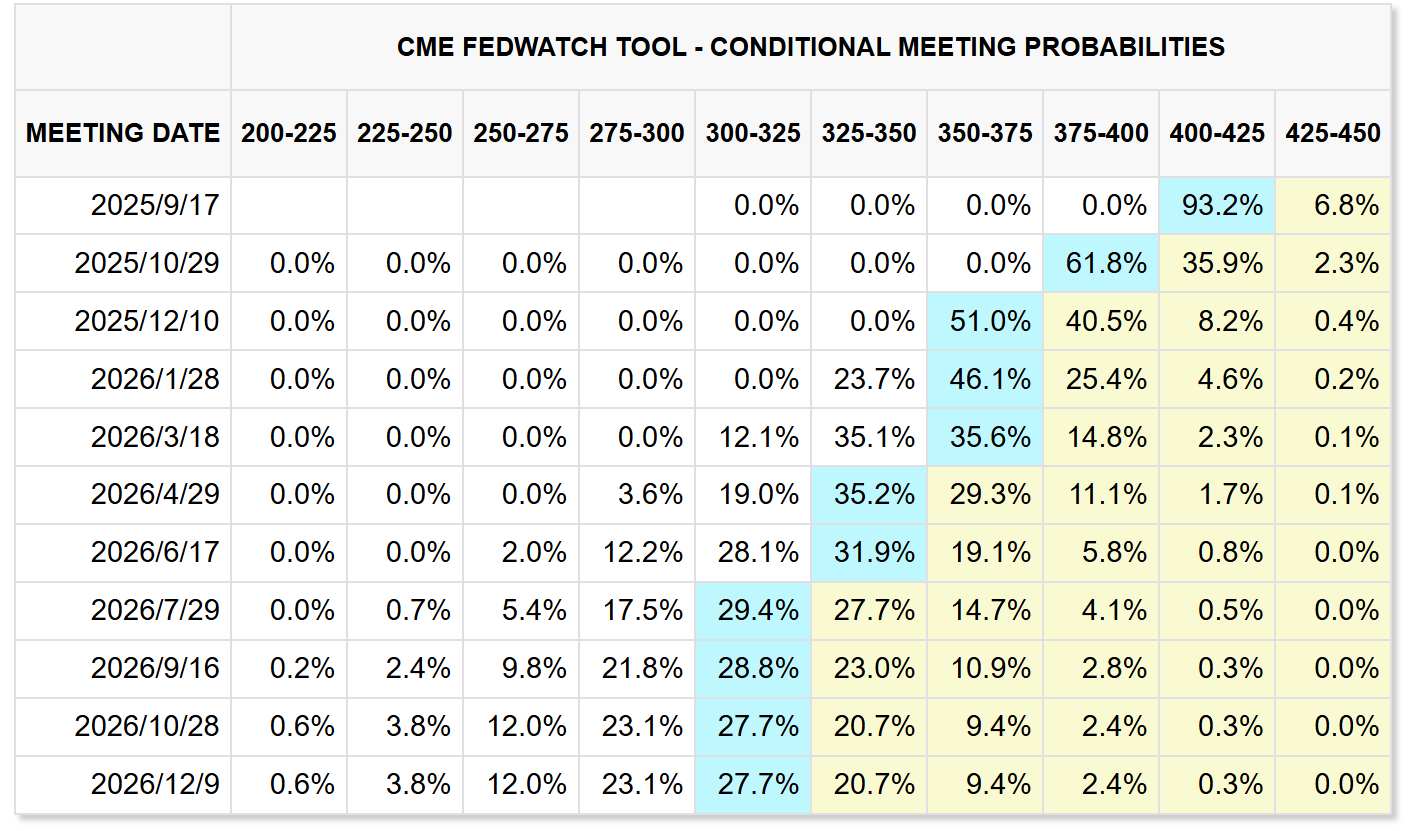
Data Sources: FedWatch, TradingKey As of: August 7, 2025
The volatility of US stocks will increase significantly in the next two months
Historical data shows that the stock market exhibits clear seasonal effects — typically weakened in August and September, with volatility rising. This seasonal weakness is driven by multiple factors, including concentrated earnings releases, investor behavior such as profit-taking following gains, and macroeconomic dynamics, most notably the end of the fiscal year, new government budget approvals, and debt ceiling negotiations that introduce fresh uncertainties.
.jpg)
Data Sources: Reuters, TradingKey As of: August 7, 2025
Furthermore, a clear pattern emerged from 25Q2 earnings: only a handful of companies continued to see their stock prices rise after earnings were released. The majority experience weak price performance, particularly those reporting flat or below-expectation profits, which often face significant sell-offs.
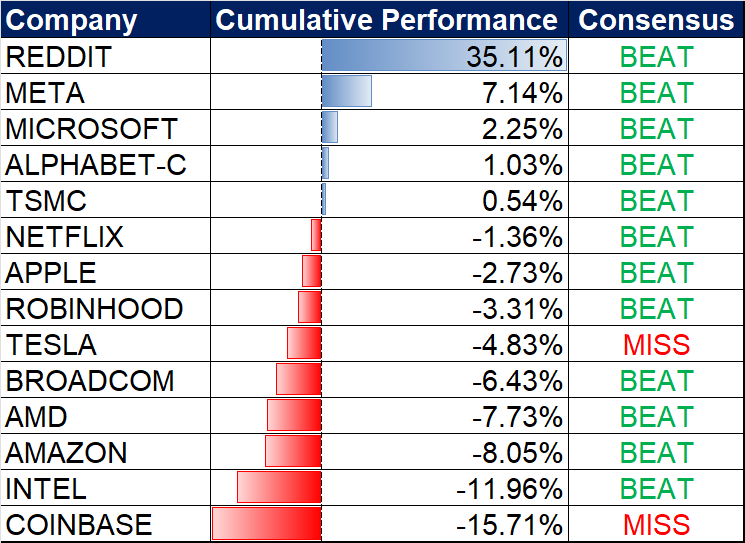
Stock price performance within three trading days after the financial report was released
Data Sources:TradingKey As of: August 7, 2025
At the core, this weakness is primarily due to valuations being excessively high. In my previous article, “Would You Rather Ride the Bubble or Risk Missing Out?” I detailed how the valuations of most U.S. tech companies, propelled by the AI narrative, have generally surpassed 30 times earnings. Meanwhile, the S&P 500 and Nasdaq indexes, buoyed by AI-driven stocks, have reached historically elevated valuation percentiles. Against this backdrop, any failure by companies to meet these optimistic profit expectations makes their share prices vulnerable to steep declines.
More importantly, in this global AI investment craze, only a handful of firms are genuinely benefiting from AI dividends, though this has yet to be reflected in the broader financial performance or profitability of most companies. Meanwhile, as growth in traditional businesses slows, the heavy capital expenditures previously undertaken by tech giants are starting to weigh on profit margins. As a result, the profit growth of the M7 group is expected to decelerate gradually going forward.
.jpg)
Data Sources: Strategas, TradingKey As of: August 7, 2025
Rate cuts may actually be the true trigger for a deeper sell-off in U.S. stocks
At this point, investors are likely aware that the market remains extremely overvalued, yet many are reluctant to exit, still pinning their hopes on upcoming Federal Reserve rate cuts. Indeed, a cut before year-end now seems all but certain. However, it is important to caution that rate cuts could very well mark the true opening of a new downward phase for equities.
In fact, hard lessons from history show that at the start of the previous U.S. easing cycles, stocks and most major asset classes initially suffered sharp declines. This includes classical safe-haven commodities like gold and silver, as well as equities, which theoretically benefit from liquidity injections.
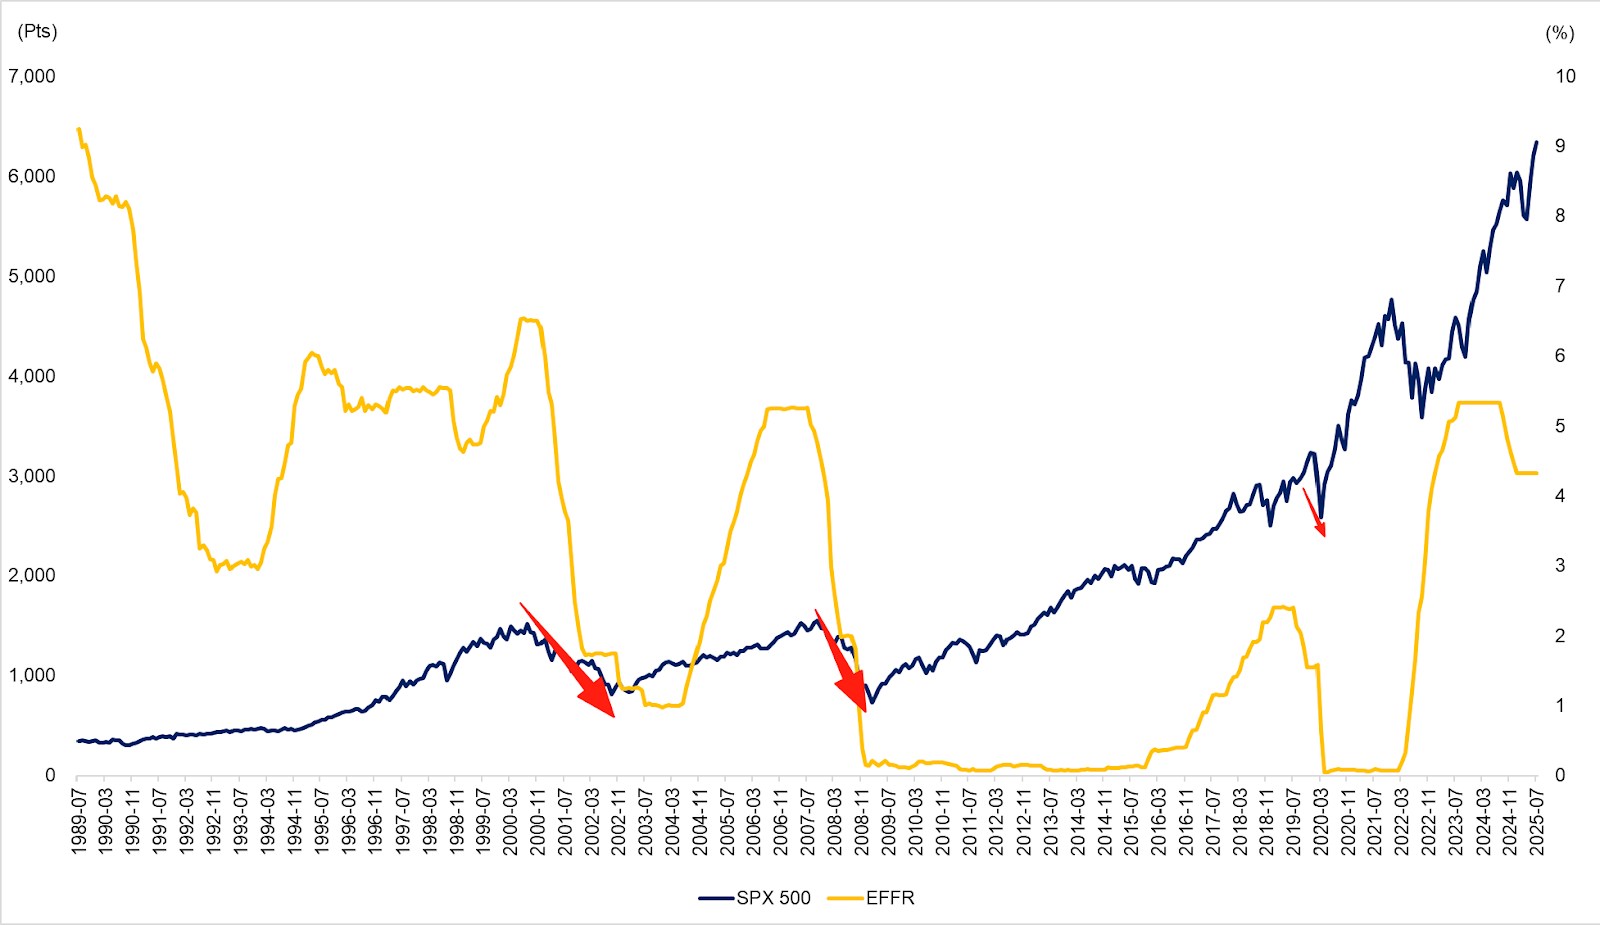
The S&P 500 tends to fall rapidly every time a rate-cut is initiated
Data Sources: Reuters, TradingKey As of: August 7, 2025
Although each cycle’s backdrop differs, the fundamental driver behind this pattern is economic recession. By the time the Fed chair announces a rate cut, the question is no longer whether a recession will occur, but whether the easing is “too late.” This implies that the economy’s landing is inevitable but uncertain in severity, hard or soft. If recession signals are already evident at the time of the cut, it constitutes a reactive, “rescue” cut; if not, it’s a preventive measure. Compared with preventive easing, rescue cuts tend to precede much more volatile market behavior.
Recent disappointing employment data have raised fears that what might have been a soft landing is at risk of turning into a hard one. Meanwhile, consumer demand is cooling amid a combination of high interest rates and lingering tariff pressures.
Although the incoming Fed chair, nominated by the Trump administration, is expected to align fully with the Treasury and White House’s push for aggressive easing, abandoning the Fed’s traditional policy independence, the U.S. economy’s ability to withstand stress until at least May next year remains uncertain. Under Jerome Powell’s previously stated playbook, rate cuts will be withheld until clear, widespread recessionary signals emerge.
ETFs Worth Watching
In summary, given the uncertainties facing the U.S. stock market and the current overvaluation, investors who wish to stay invested or are reluctant to exit may consider using the following two ETFs to hedge their positions.
- Long volatility via ProShares Short-Term VIX Futures ETF (VIXY)
- Short the Dow Jones Industrial Average via ProShares Short Dow 30 ETF (DOG)
The former tracks the widely recognized VIX Index (Chicago Board Options Exchange’s Market Volatility Index) which measures the implied volatility of S&P 500 index options and is commonly known as the “fear gauge.” The VIX typically fluctuates between 10 and 30 points. When the index stays below 20, it signals a relatively stable market environment. However, during periods of significant market turbulence, especially sharp sell-offs, the VIX surges, reflecting heightened investor anxiety and offering an opportunity for gains. Levels above 30 often indicate extreme panic in the market.
The latter ETF achieves hedging by shorting the Dow Jones Industrial Average (DJIA). Why choose the Dow over the S&P 500 or Nasdaq indexes?
Primarily because the DJIA currently shows more pronounced signs of having peaked and underperforms relative to the other two indexes. This is partly due to its much lower weighting of tech giants. This assessment is further supported by the U.S. ISM Manufacturing PMI, which has remained below the expansion-contraction threshold since 2022, signaling continued weakness in the manufacturing sector. Moreover, except for AI-related investments, U.S. companies face very high borrowing costs and robust capital market returns, leaving little incentive for expanding investments or increasing capital expenditures.
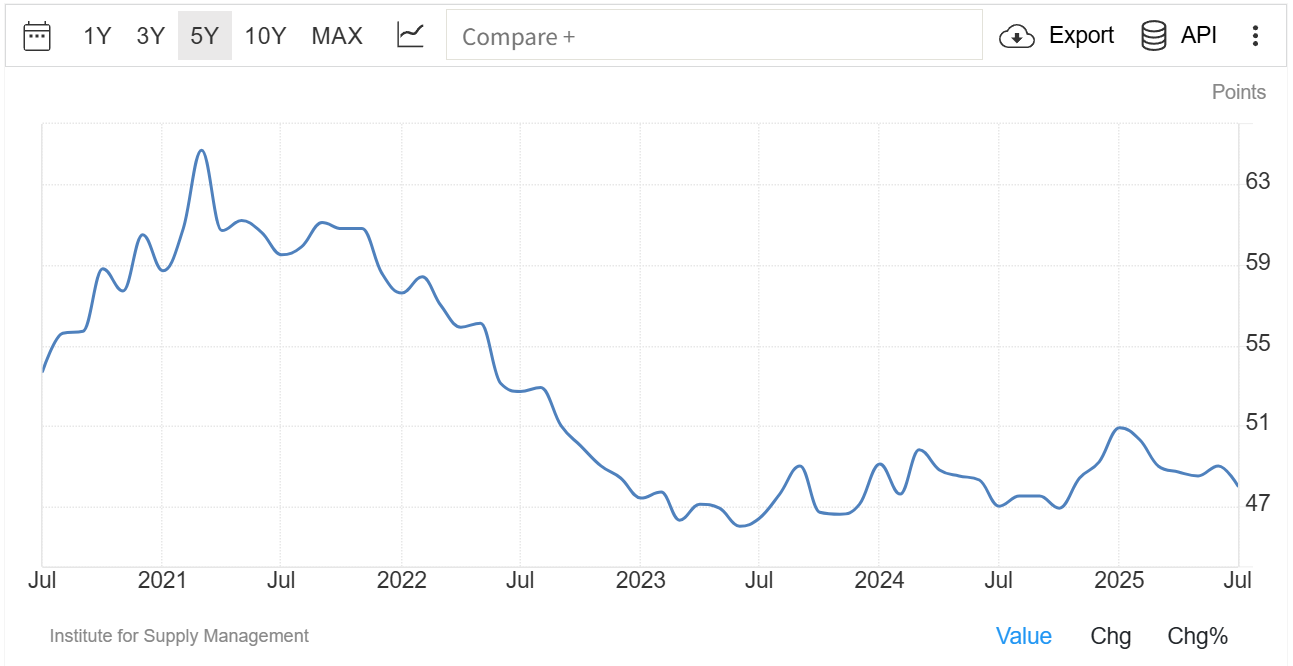
United States ISM Manufacturing PMI
Data Sources: Reuters, TradingKey As of: August 7, 2025
From a technical perspective, the Dow has been trading within a broad range since November last year. The 45,000 level has proven to be a strong resistance point, with multiple failed attempts to break higher. Following last Friday’s sharp downward revision in labor data, the index gapped down, falling below 44,100. While a short-term rebound to test resistance is likely, failure to recapture this level in the coming days raises the risk of a further decline. Conversely, if the Dow recovers above 44,100, drawing on price action since January, investors may look to re-enter, targeting the 45,000 resistance zone.
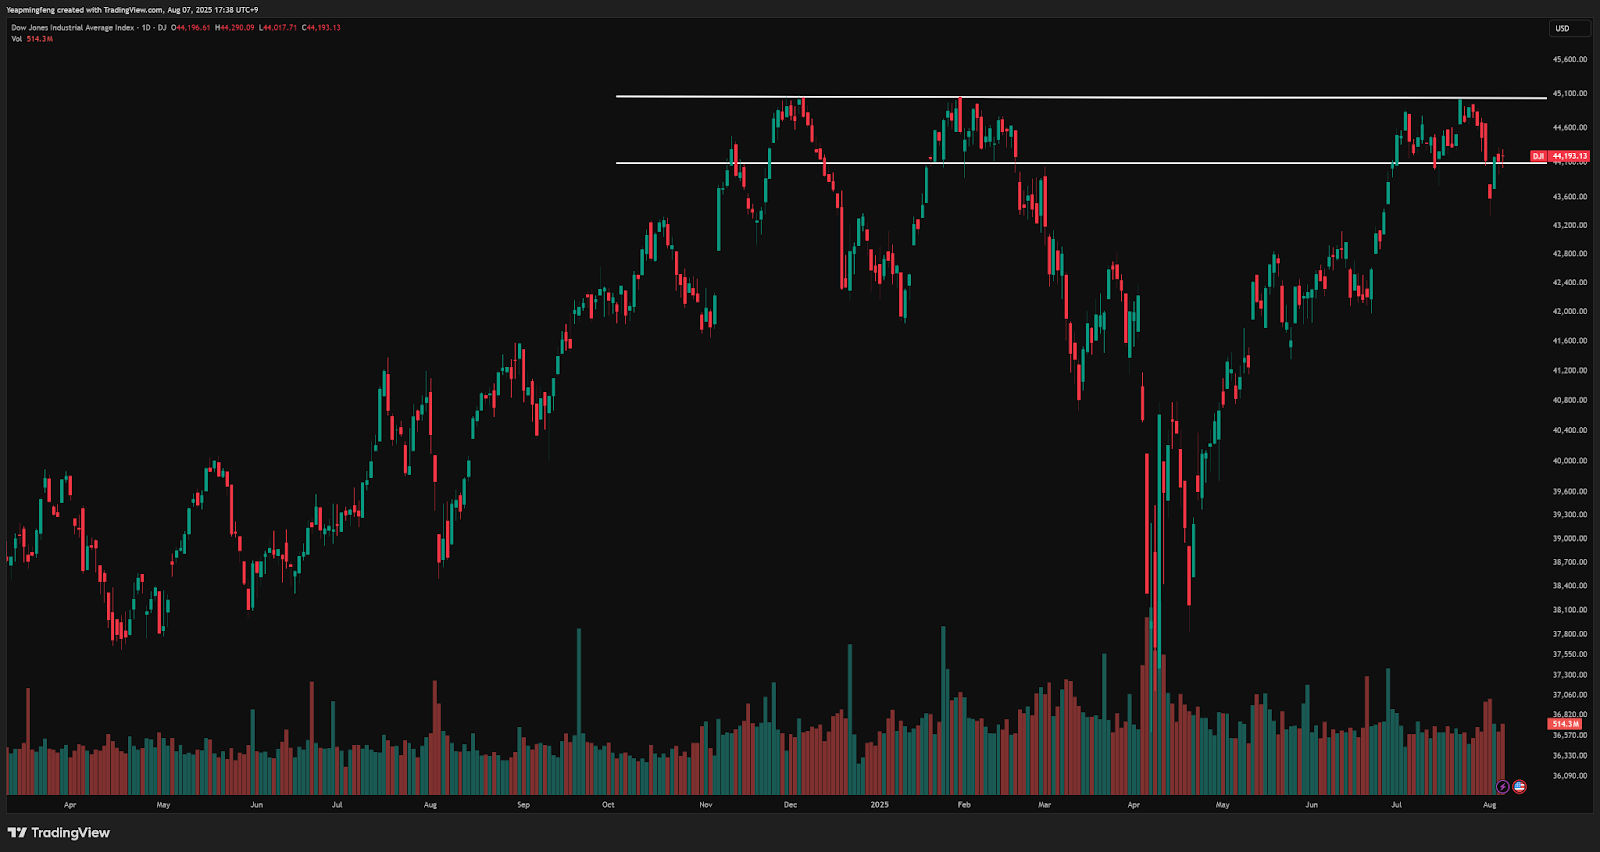
Data Sources: TradingView, TradingKey As of: August 7, 2025

Get Started
Find out more