Is the IBIT stock a buy as the BlackRock Bitcoin ETF loses traction?
The iShares Bitcoin Trust stock pulled back to a crucial support level as Bitcoin price lost momentum.
- The IBIT ETF has pulled back this month, mirroring the performance of Bitcoin.
- A technical analysis on Bitcoin points to an eventual IBIT rebound.
- BTC has formed a bullish flag and a break-and-retest pattern.
The IBIT ETF retreated to a low of $63.80 this week, down 8.40% from its highest point this year. It remains about 51% above its lowest level in 2025.
SoSoValue data shows the fund has lost momentum in terms of inflows. It recorded a net outflow of $77 million on Tuesday, bringing total net assets to $83.8 billion. Since inception, cumulative inflows have reached $57 billion.
IBIT has become the most successful ETF ever, with total assets peaking above $86 billion in July. It is also BlackRock’s eighth-largest and most profitable ETF.
BlackRock’s BTC ETF $IBIT is the most successful ETF launch in history, and it’s not even close. IBIT (orange line) hit $10 billion in assets under management in a record 34 days: pic.twitter.com/Xejew300eK
— Stephen McBride (@DisruptionHedge) August 4, 2025
Other spot Bitcoin (BTC) ETFs have also lost traction this month. They recorded outflows of $196 million on Tuesday, bringing total outflows to over $1.4 billion.
Is the IBIT stock a good buy today?
The IBIT ETF moves in sync with the performance of Bitcoin. As such, the best way to predict its trajectory is to analyze Bitcoin price action.
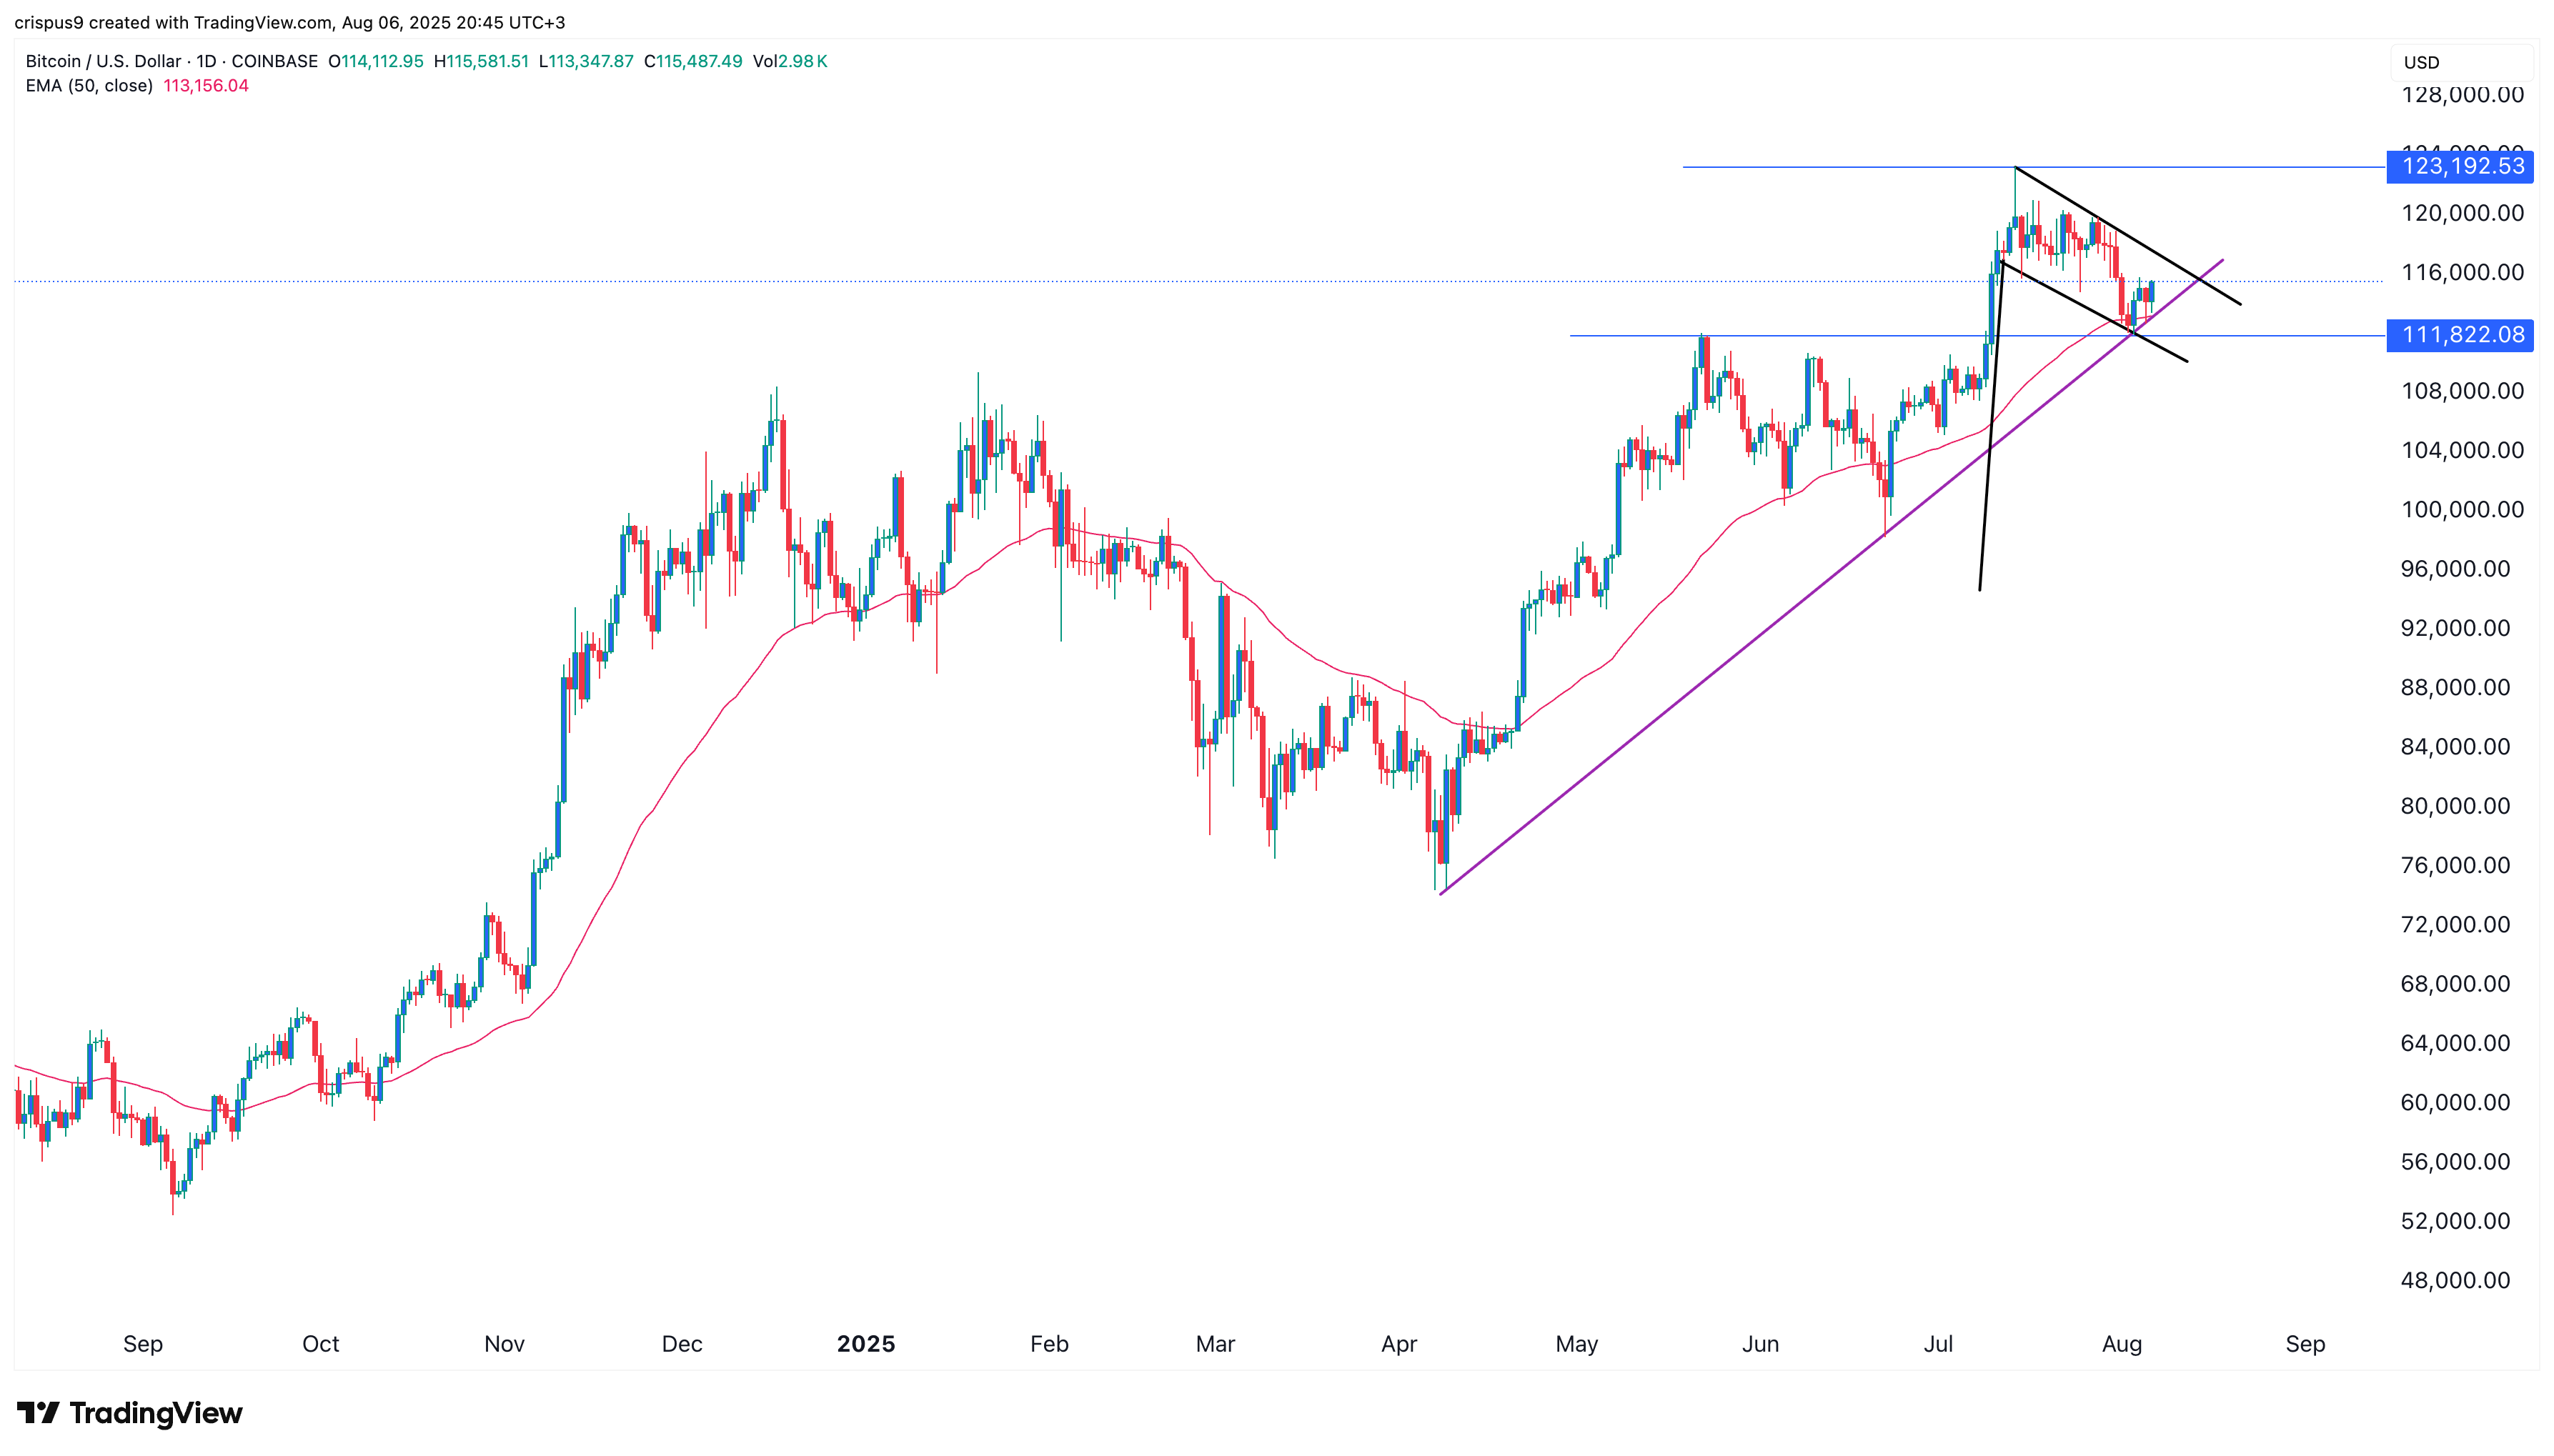
The daily chart above shows that Bitcoin price has pulled back since July 14. It dropped from a high of $123,192 to a low of $112,000, its highest swing on May 23rd.
Bitcoin has formed a bullish flag pattern, a common continuation signal. This pattern consists of a vertical rally followed by a descending channel and often leads to a breakout.
BTC has also completed a break-and-retest pattern, moving back to $112,000, a key support level. This type of retest is often seen as a signal of trend continuation.
Additionally, Bitcoin has done a mean reversion by declining to the 50-day Exponential Moving Average. It has also retested the ascending trendline connecting the lows since April.
Therefore, the most likely scenario is a rebound toward the all-time high of $123,192. A break above that level would confirm a bullish breakout and potentially push BTC to $125,000. If this plays out, the IBIT ETF is also expected to rebound, as it closely tracks Bitcoin’s price.
免责声明:投资有风险,本文并非投资建议,以上内容不应被视为任何金融产品的购买或出售要约、建议或邀请,作者或其他用户的任何相关讨论、评论或帖子也不应被视为此类内容。本文仅供一般参考,不考虑您的个人投资目标、财务状况或需求。TTM对信息的准确性和完整性不承担任何责任或保证,投资者应自行研究并在投资前寻求专业建议。
热议股票
- 1
- 2
- 3
- 4
- 5
- 6
- 7
- 8
- 9
- 10