The Market Lifts GRC Limited (SGX:S3N) Shares 44% But It Can Do More
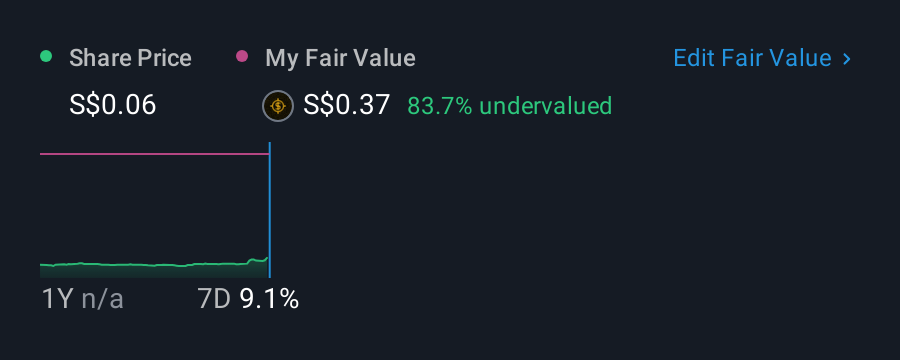
GRC Limited (SGX:S3N) shareholders have had their patience rewarded with a 44% share price jump in the last month. Longer-term shareholders would be thankful for the recovery in the share price since it's now virtually flat for the year after the recent bounce.
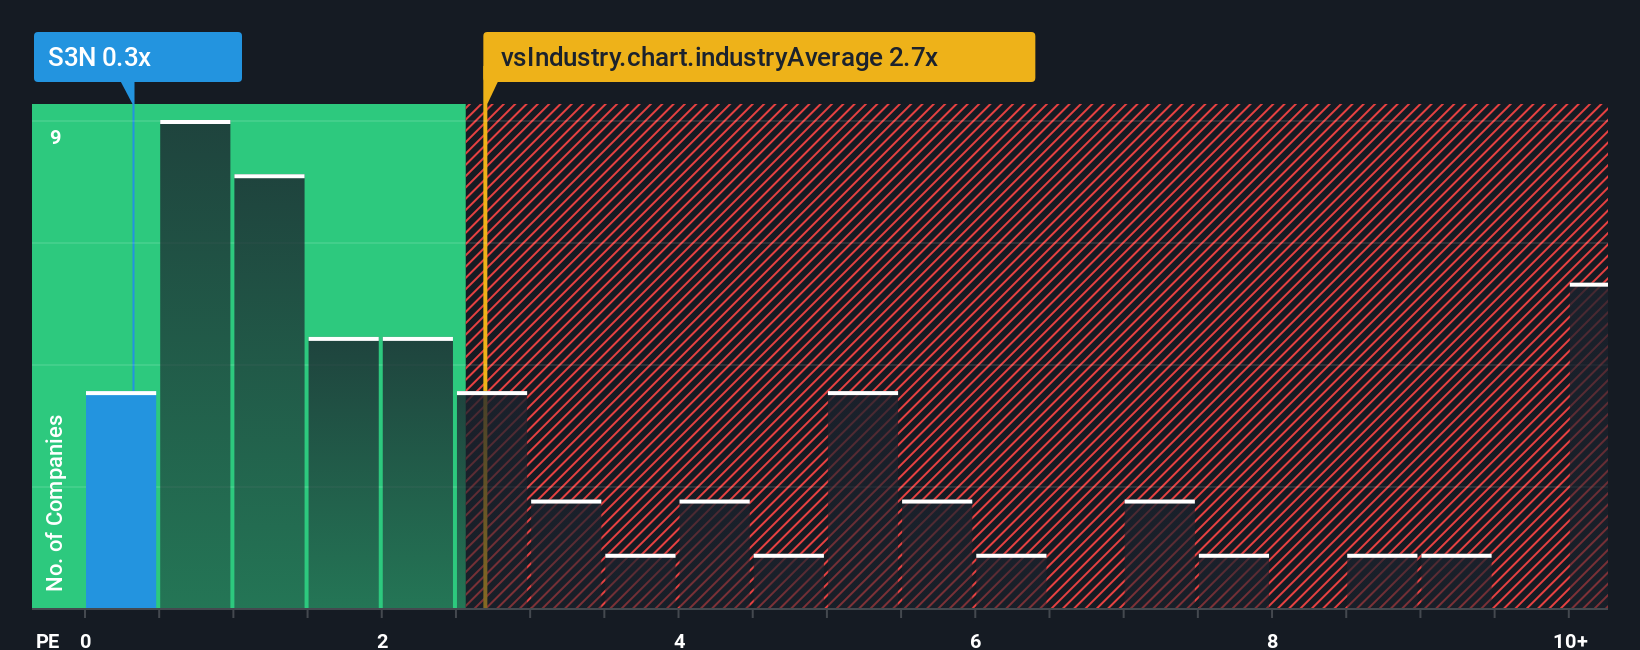
In spite of the firm bounce in price, GRC may still be sending very bullish signals at the moment with its price-to-sales (or "P/S") ratio of 0.3x, since almost half of all companies in the Real Estate industry in Singapore have P/S ratios greater than 2.7x and even P/S higher than 6x are not unusual. However, the P/S might be quite low for a reason and it requires further investigation to determine if it's justified.
AI is about to change healthcare. These 20 stocks are working on everything from early diagnostics to drug discovery. The best part - they are all under $10bn in marketcap - there is still time to get in early.
Check out our latest analysis for GRC
What Does GRC's Recent Performance Look Like?
GRC has been doing a good job lately as it's been growing revenue at a solid pace. It might be that many expect the respectable revenue performance to degrade substantially, which has repressed the P/S. If that doesn't eventuate, then existing shareholders have reason to be optimistic about the future direction of the share price.
Want the full picture on earnings, revenue and cash flow for the company? Then our free report on GRC will help you shine a light on its historical performance.How Is GRC's Revenue Growth Trending?
The only time you'd be truly comfortable seeing a P/S as depressed as GRC's is when the company's growth is on track to lag the industry decidedly.
Retrospectively, the last year delivered a decent 7.8% gain to the company's revenues. Pleasingly, revenue has also lifted 37% in aggregate from three years ago, partly thanks to the last 12 months of growth. Therefore, it's fair to say the revenue growth recently has been superb for the company.
In contrast to the company, the rest of the industry is expected to decline by 5.8% over the next year, which puts the company's recent medium-term positive growth rates in a good light for now.
In light of this, it's quite peculiar that GRC's P/S sits below the majority of other companies. Apparently some shareholders believe the recent performance has exceeded its limits and have been accepting significantly lower selling prices.
The Key Takeaway
Shares in GRC have risen appreciably however, its P/S is still subdued. Using the price-to-sales ratio alone to determine if you should sell your stock isn't sensible, however it can be a practical guide to the company's future prospects.
Upon analysing the past data, we see it is unexpected that GRC is currently trading at a lower P/S than the rest of the industry given that its revenue growth in the past three-year years is exceeding expectations in a challenging industry. There could be some major unobserved threats to revenue preventing the P/S ratio from matching this positive performance. The most obvious risk is that its revenue trajectory may not keep outperforming under these tough industry conditions. At least the risk of a price drop looks to be subdued, but investors think future revenue could see a lot of volatility.
A lot of potential risks can sit within a company's balance sheet. Our free balance sheet analysis for GRC with six simple checks will allow you to discover any risks that could be an issue.
If strong companies turning a profit tickle your fancy, then you'll want to check out this free list of interesting companies that trade on a low P/E (but have proven they can grow earnings).
New: Manage All Your Stock Portfolios in One Place
We've created the ultimate portfolio companion for stock investors, and it's free.
• Connect an unlimited number of Portfolios and see your total in one currency• Be alerted to new Warning Signs or Risks via email or mobile• Track the Fair Value of your stocks
Try a Demo Portfolio for FreeHave feedback on this article? Concerned about the content? Get in touch with us directly. Alternatively, email editorial-team (at) simplywallst.com.This article by Simply Wall St is general in nature. We provide commentary based on historical data and analyst forecasts only using an unbiased methodology and our articles are not intended to be financial advice. It does not constitute a recommendation to buy or sell any stock, and does not take account of your objectives, or your financial situation. We aim to bring you long-term focused analysis driven by fundamental data. Note that our analysis may not factor in the latest price-sensitive company announcements or qualitative material. Simply Wall St has no position in any stocks mentioned.
免责声明:投资有风险,本文并非投资建议,以上内容不应被视为任何金融产品的购买或出售要约、建议或邀请,作者或其他用户的任何相关讨论、评论或帖子也不应被视为此类内容。本文仅供一般参考,不考虑您的个人投资目标、财务状况或需求。TTM对信息的准确性和完整性不承担任何责任或保证,投资者应自行研究并在投资前寻求专业建议。
热议股票
- 1
- 2
- 3
- 4
- 5
- 6
- 7
- 8
- 9
- 10