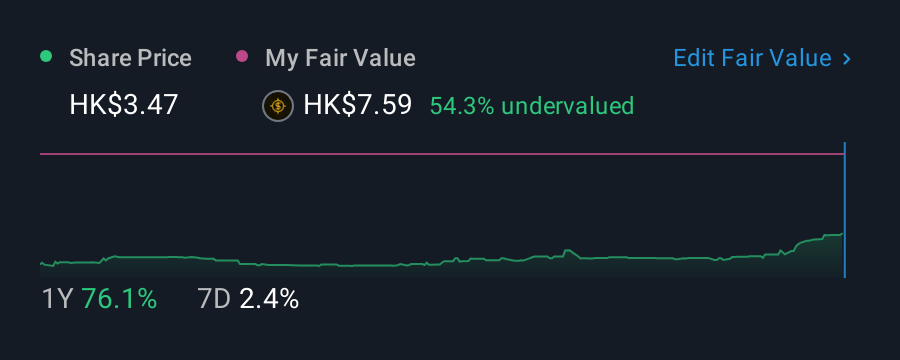
Wenling Zhejiang Measuring and Cutting Tools Trading Centre Company Limited (HKG:1379) shareholders have had their patience rewarded with a 32% share price jump in the last month. The last 30 days bring the annual gain to a very sharp 46%.
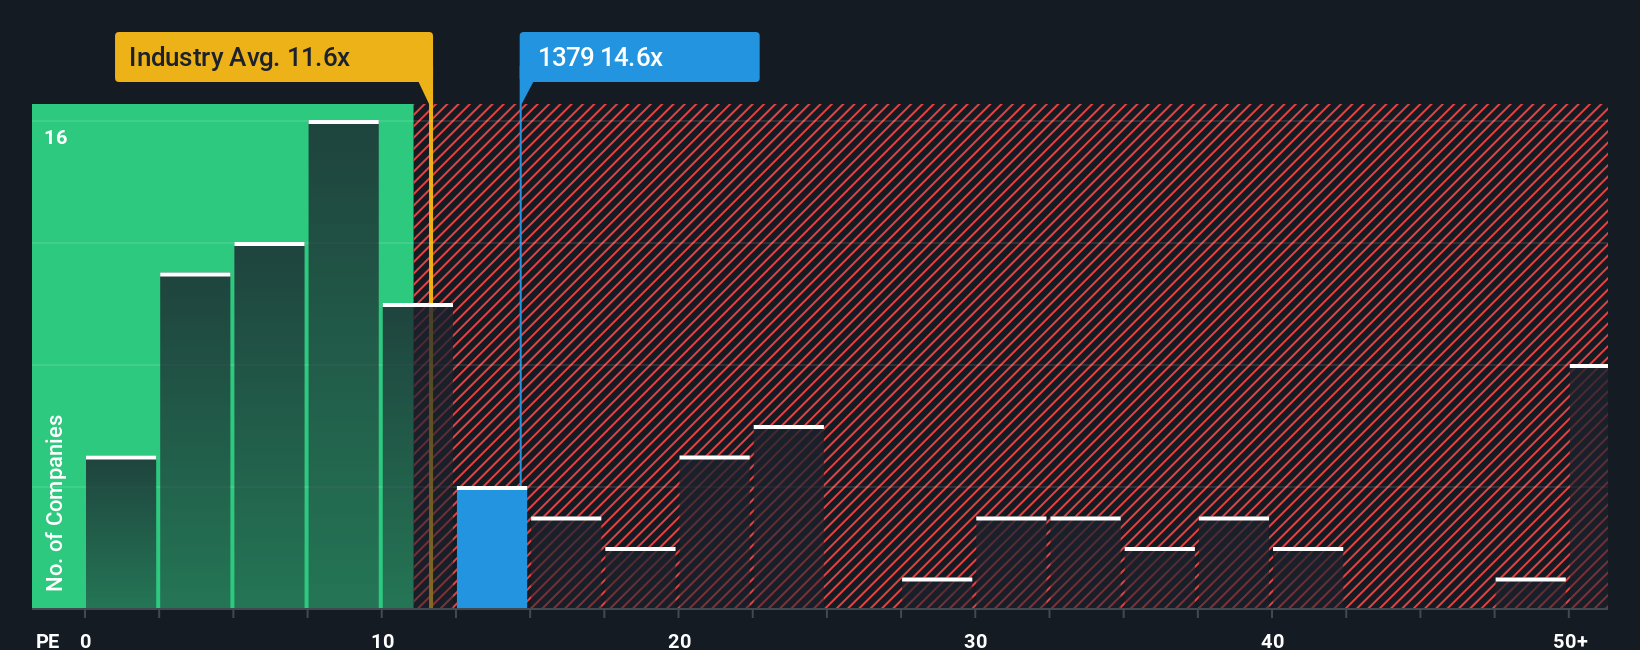
Although its price has surged higher, it's still not a stretch to say that Wenling Zhejiang Measuring and Cutting Tools Trading Centre's price-to-earnings (or "P/E") ratio of 14.6x right now seems quite "middle-of-the-road" compared to the market in Hong Kong, where the median P/E ratio is around 13x. While this might not raise any eyebrows, if the P/E ratio is not justified investors could be missing out on a potential opportunity or ignoring looming disappointment.
This technology could replace computers: discover the 20 stocks are working to make quantum computing a reality.
For instance, Wenling Zhejiang Measuring and Cutting Tools Trading Centre's receding earnings in recent times would have to be some food for thought. It might be that many expect the company to put the disappointing earnings performance behind them over the coming period, which has kept the P/E from falling. If not, then existing shareholders may be a little nervous about the viability of the share price.
See our latest analysis for Wenling Zhejiang Measuring and Cutting Tools Trading Centre
Does Growth Match The P/E?
Wenling Zhejiang Measuring and Cutting Tools Trading Centre's P/E ratio would be typical for a company that's only expected to deliver moderate growth, and importantly, perform in line with the market.
Taking a look back first, the company's earnings per share growth last year wasn't something to get excited about as it posted a disappointing decline of 45%. This means it has also seen a slide in earnings over the longer-term as EPS is down 68% in total over the last three years. Accordingly, shareholders would have felt downbeat about the medium-term rates of earnings growth.
Comparing that to the market, which is predicted to deliver 21% growth in the next 12 months, the company's downward momentum based on recent medium-term earnings results is a sobering picture.
With this information, we find it concerning that Wenling Zhejiang Measuring and Cutting Tools Trading Centre is trading at a fairly similar P/E to the market. Apparently many investors in the company are way less bearish than recent times would indicate and aren't willing to let go of their stock right now. There's a good chance existing shareholders are setting themselves up for future disappointment if the P/E falls to levels more in line with the recent negative growth rates.
What We Can Learn From Wenling Zhejiang Measuring and Cutting Tools Trading Centre's P/E?
Wenling Zhejiang Measuring and Cutting Tools Trading Centre appears to be back in favour with a solid price jump getting its P/E back in line with most other companies. Typically, we'd caution against reading too much into price-to-earnings ratios when settling on investment decisions, though it can reveal plenty about what other market participants think about the company.
We've established that Wenling Zhejiang Measuring and Cutting Tools Trading Centre currently trades on a higher than expected P/E since its recent earnings have been in decline over the medium-term. When we see earnings heading backwards and underperforming the market forecasts, we suspect the share price is at risk of declining, sending the moderate P/E lower. Unless the recent medium-term conditions improve, it's challenging to accept these prices as being reasonable.
Plus, you should also learn about these 4 warning signs we've spotted with Wenling Zhejiang Measuring and Cutting Tools Trading Centre (including 1 which can't be ignored).
If you're unsure about the strength of Wenling Zhejiang Measuring and Cutting Tools Trading Centre's business, why not explore our interactive list of stocks with solid business fundamentals for some other companies you may have missed.
Valuation is complex, but we're here to simplify it.
Discover if Wenling Zhejiang Measuring and Cutting Tools Trading Centre might be undervalued or overvalued with our detailed analysis, featuring fair value estimates, potential risks, dividends, insider trades, and its financial condition.
Access Free AnalysisHave feedback on this article? Concerned about the content? Get in touch with us directly. Alternatively, email editorial-team (at) simplywallst.com.This article by Simply Wall St is general in nature. We provide commentary based on historical data and analyst forecasts only using an unbiased methodology and our articles are not intended to be financial advice. It does not constitute a recommendation to buy or sell any stock, and does not take account of your objectives, or your financial situation. We aim to bring you long-term focused analysis driven by fundamental data. Note that our analysis may not factor in the latest price-sensitive company announcements or qualitative material. Simply Wall St has no position in any stocks mentioned.