There's No Escaping Amicus Therapeutics, Inc.'s (NASDAQ:FOLD) Muted Revenues Despite A 26% Share Price Rise
The Amicus Therapeutics, Inc. (NASDAQ:FOLD) share price has done very well over the last month, posting an excellent gain of 26%. Unfortunately, the gains of the last month did little to right the losses of the last year with the stock still down 35% over that time.
In spite of the firm bounce in price, Amicus Therapeutics' price-to-sales (or "P/S") ratio of 4.1x might still make it look like a strong buy right now compared to the wider Biotechs industry in the United States, where around half of the companies have P/S ratios above 9.1x and even P/S above 63x are quite common. Nonetheless, we'd need to dig a little deeper to determine if there is a rational basis for the highly reduced P/S.
AI is about to change healthcare. These 20 stocks are working on everything from early diagnostics to drug discovery. The best part - they are all under $10bn in marketcap - there is still time to get in early.
Check out our latest analysis for Amicus Therapeutics
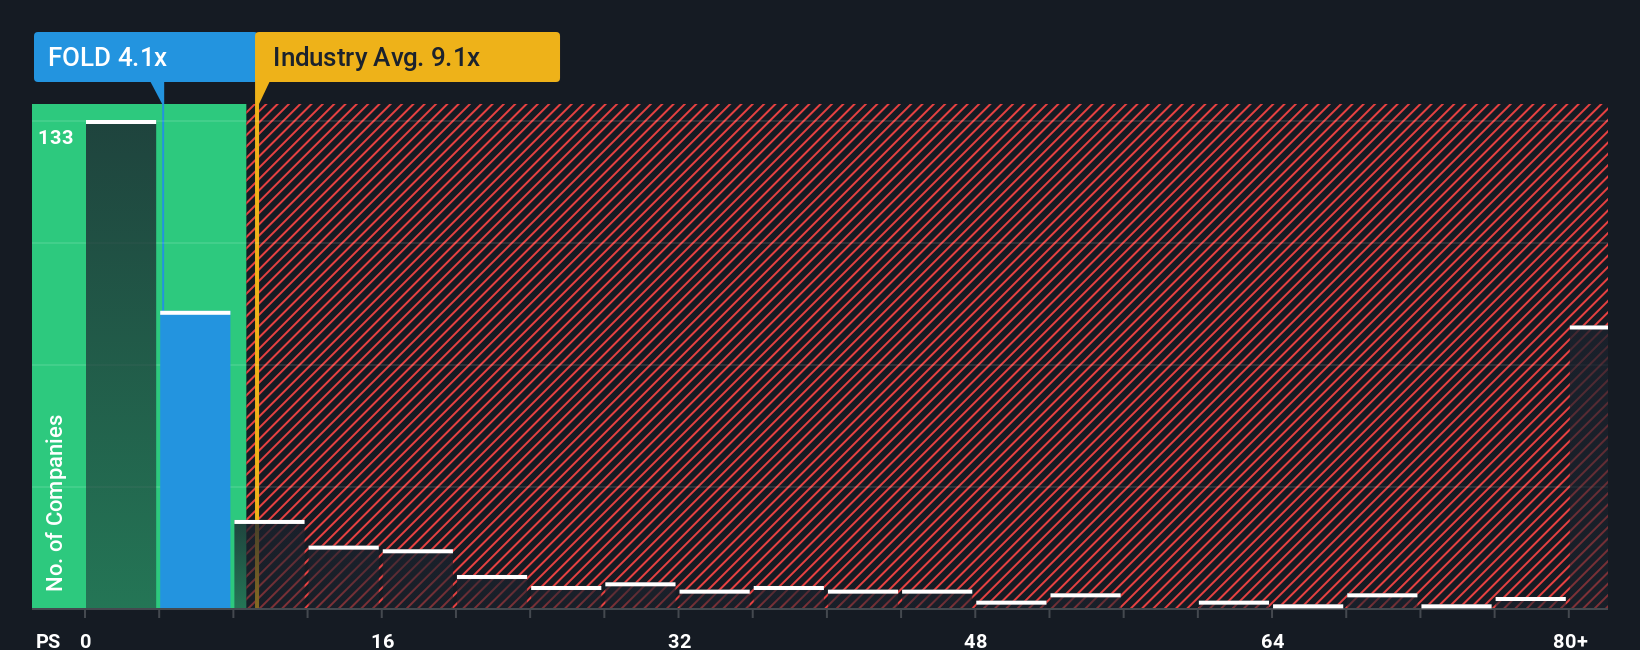
What Does Amicus Therapeutics' P/S Mean For Shareholders?
With revenue growth that's inferior to most other companies of late, Amicus Therapeutics has been relatively sluggish. It seems that many are expecting the uninspiring revenue performance to persist, which has repressed the growth of the P/S ratio. If you still like the company, you'd be hoping revenue doesn't get any worse and that you could pick up some stock while it's out of favour.
If you'd like to see what analysts are forecasting going forward, you should check out our free report on Amicus Therapeutics.Is There Any Revenue Growth Forecasted For Amicus Therapeutics?
Amicus Therapeutics' P/S ratio would be typical for a company that's expected to deliver very poor growth or even falling revenue, and importantly, perform much worse than the industry.
Taking a look back first, we see that the company grew revenue by an impressive 25% last year. The latest three year period has also seen an excellent 78% overall rise in revenue, aided by its short-term performance. Accordingly, shareholders would have definitely welcomed those medium-term rates of revenue growth.
Turning to the outlook, the next three years should generate growth of 20% per annum as estimated by the twelve analysts watching the company. That's shaping up to be materially lower than the 115% per annum growth forecast for the broader industry.
With this in consideration, its clear as to why Amicus Therapeutics' P/S is falling short industry peers. Apparently many shareholders weren't comfortable holding on while the company is potentially eyeing a less prosperous future.
The Bottom Line On Amicus Therapeutics' P/S
Amicus Therapeutics' recent share price jump still sees fails to bring its P/S alongside the industry median. We'd say the price-to-sales ratio's power isn't primarily as a valuation instrument but rather to gauge current investor sentiment and future expectations.
As expected, our analysis of Amicus Therapeutics' analyst forecasts confirms that the company's underwhelming revenue outlook is a major contributor to its low P/S. Right now shareholders are accepting the low P/S as they concede future revenue probably won't provide any pleasant surprises. Unless these conditions improve, they will continue to form a barrier for the share price around these levels.
The company's balance sheet is another key area for risk analysis. Take a look at our free balance sheet analysis for Amicus Therapeutics with six simple checks on some of these key factors.
It's important to make sure you look for a great company, not just the first idea you come across. So if growing profitability aligns with your idea of a great company, take a peek at this free list of interesting companies with strong recent earnings growth (and a low P/E).
New: Manage All Your Stock Portfolios in One Place
We've created the ultimate portfolio companion for stock investors, and it's free.
• Connect an unlimited number of Portfolios and see your total in one currency• Be alerted to new Warning Signs or Risks via email or mobile• Track the Fair Value of your stocks
Try a Demo Portfolio for FreeHave feedback on this article? Concerned about the content? Get in touch with us directly. Alternatively, email editorial-team (at) simplywallst.com.This article by Simply Wall St is general in nature. We provide commentary based on historical data and analyst forecasts only using an unbiased methodology and our articles are not intended to be financial advice. It does not constitute a recommendation to buy or sell any stock, and does not take account of your objectives, or your financial situation. We aim to bring you long-term focused analysis driven by fundamental data. Note that our analysis may not factor in the latest price-sensitive company announcements or qualitative material. Simply Wall St has no position in any stocks mentioned.
免责声明:投资有风险,本文并非投资建议,以上内容不应被视为任何金融产品的购买或出售要约、建议或邀请,作者或其他用户的任何相关讨论、评论或帖子也不应被视为此类内容。本文仅供一般参考,不考虑您的个人投资目标、财务状况或需求。TTM对信息的准确性和完整性不承担任何责任或保证,投资者应自行研究并在投资前寻求专业建议。
热议股票
- 1
- 2
- 3
- 4
- 5
- 6
- 7
- 8
- 9
- 10