Is Now the Time to Buy Vanguard High Dividend Yield ETF (VYM)?
-
The Vanguard High Dividend Yield ETF currently has double the dividend yield compared to the S&P 500.
-
Companies in the fund also trade at lower valuations compared with the broader market.
-
Slower earnings growth could yield lower total returns.
The Vanguard High Dividend Yield ETF (VYM 0.27%) follows a very simple strategy. It tracks an index that measures the returns of stocks with high dividend yields. That approach means that this exchange-traded fund (ETF) can provide investors with a lucrative stream of passive dividend income.
Here's a look at whether now is a good time to buy this top dividend ETF.

Image source: Getty Images.
An easy way to boost your dividend income
The Vanguard High Dividend Yield ETF holds over 580 stocks, most of which have above-average dividend yields. The fund currently has a 2.6% dividend yield. That's more than double the S&P 500's dividend yield, which at less than 1.2% is approaching its record low.
VYM holds several notable higher-yielding dividend stocks. For example, ExxonMobil (XOM -0.02%) is the fund's third largest holding, accounting for 2.4% of its assets. The oil giant's dividend yield is currently over 3.5%. Exxon also has an exceptional record of increasing its dividend. It has raised its dividend for 42 straight years. That's the longest streak in the oil patch and a milestone only 4% of companies in the S&P 500 have reached.
The fund's focus on investing in stocks with higher dividend yields enables it to generate more income for investors. For example, every $1,000 invested in the Vanguard High Dividend Yield ETF would produce about $26 of annual dividend income. That compares to around $12 in dividend income from a similar investment in an S&P 500 ETF such as the Vanguard S&P 500 ETF (VOO 0.41%). While investors pay a slightly higher ETF expense ratio for YVM, at 0.06%, compared with 0.03% for VOO, it costs them only about $0.60 each year, compared with $0.30 annually for VOO. So they'll still collect a lot more dividend income with this ETF.
A relatively more attractive valuation
One reason the Vanguard High Dividend Yield ETF offers a much higher yield compared to the broader market is that it holds companies trading at lower valuations. The 580 stocks currently held by the ETF trade at a price-to-earnings (P/E) ratio of 19.6 and a price-to-book (P/B) ratio of 2.8. That compares with a P/E ratio of 27.6 and a P/B ratio of 5.0.
That higher valuation is due in part to the S&P 500's bigger run-up over the past year compared with VYM:
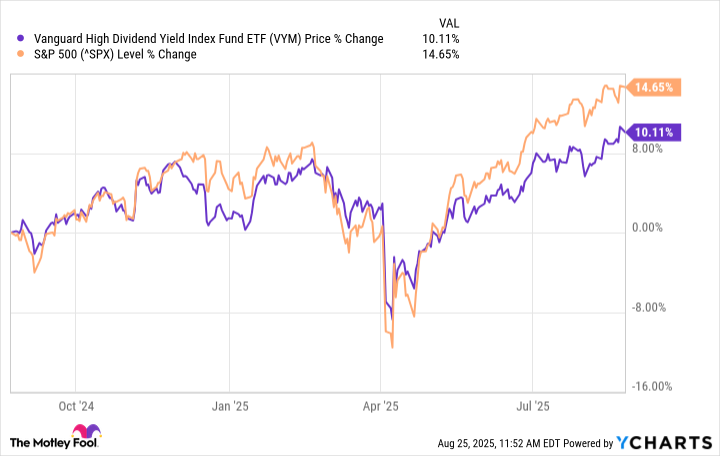
VYM data by YCharts
In addition, higher-yielding companies often trade at lower valuations because they tend to be slower-growing. For example, VYM stocks have averaged 13.3% annual earnings growth over the past five years. That compares to S&P 500 companies, which have achieved a 23.4% average annual earnings growth rate over the past five years. The average S&P 500 company tends to retain a greater percentage of its earnings to fund its continued growth, whereas the typical YYM holding allocates a larger portion of its income to paying dividends.
While value-oriented income stocks in the Vanguard High Dividend Yield ETF likely won't outperform an S&P 500 index fund over the long term, the fund has still delivered solid returns over the past decade:
Fund | 1-Year | 3-Year | 5-Year | 10-Year |
|---|---|---|---|---|
VYM | 10.9% | 11.3% | 14% | 10.4% |
VOO | 16.3% | 17.1% | 15.9% | 13.6% |
Data source: Vanguard.
Given its lower relative valuation and higher income yield, VYM should continue delivering solid total returns for its investors, likely with less volatility compared with an S&P 500 index fund.
A rock-solid dividend ETF to buy and hold long term
If you want to collect more dividend income, consider buying the Vanguard High Dividend Yield ETF right now. This fund delivers a more attractive income stream compared to the broader market, partly because it holds stocks with lower relative valuations. While this ETF may not outperform the more growth-oriented S&P 500 over the long term, as it aims to deliver more income rather than high growth, it provides investors with a solid option for income and less volatile stock market exposure.
免责声明:投资有风险,本文并非投资建议,以上内容不应被视为任何金融产品的购买或出售要约、建议或邀请,作者或其他用户的任何相关讨论、评论或帖子也不应被视为此类内容。本文仅供一般参考,不考虑您的个人投资目标、财务状况或需求。TTM对信息的准确性和完整性不承担任何责任或保证,投资者应自行研究并在投资前寻求专业建议。
热议股票
- 1
- 2
- 3
- 4
- 5
- 6
- 7
- 8
- 9
- 10