TradingKey - DeepMind releases several new-generation embodied AI models, boosting the stock price in a near 3% rebound, but it may be difficult to break through the double resistance level of $360 in the short term.
On July 31 Eastern Time, shares of Google's parent company Alphabet ( GOOG) surged nearly 3% in pre-market trading, briefly breaking through $340 and temporarily trading at $338.95. On the news front, Google DeepMind released several embodied AI models, including Gemini Robotics 2, Gemini Robotics ER 2, and On-Device 2, aiming to solve the long-standing challenges of whole-body coordination and movement dexterity faced by humanoid robots.
Google's newly released next-generation robotic AI models demonstrate a breakthrough in combining large language models (LLMs) with physical-world terminals, timely rescuing oversold market confidence and catalyzing a strong rebound in its stock price. Previously, the market had been anxious and concerned about Google's monetization efficiency amid skyrocketing capital expenditures (CapEx) for generative AI and cloud, leading to a continuous decline in the stock price.
On May 18 of this year, Alphabet's stock price surged past the $400 mark, rising to an intraday historical high of $405. Since then, its stock price has continued to slide, with the drop accelerating especially after the earnings report, falling to $315 on July 24, setting a near 4-month high and bringing the maximum drawdown to 22%.
This week, Alphabet's stock price staged an oversold rebound, rising slightly in each trading session to recoup some of its previous losses and narrowing its decline over the past month. Currently, Alphabet's stock price is touching the middle line of the downward channel at $330, which exerts some resistance but is not strong, and it may further rise to $360, where it will face double pressure from the upper line and the median line (Fibonacci 0.5 level), potentially triggering a technical correction.
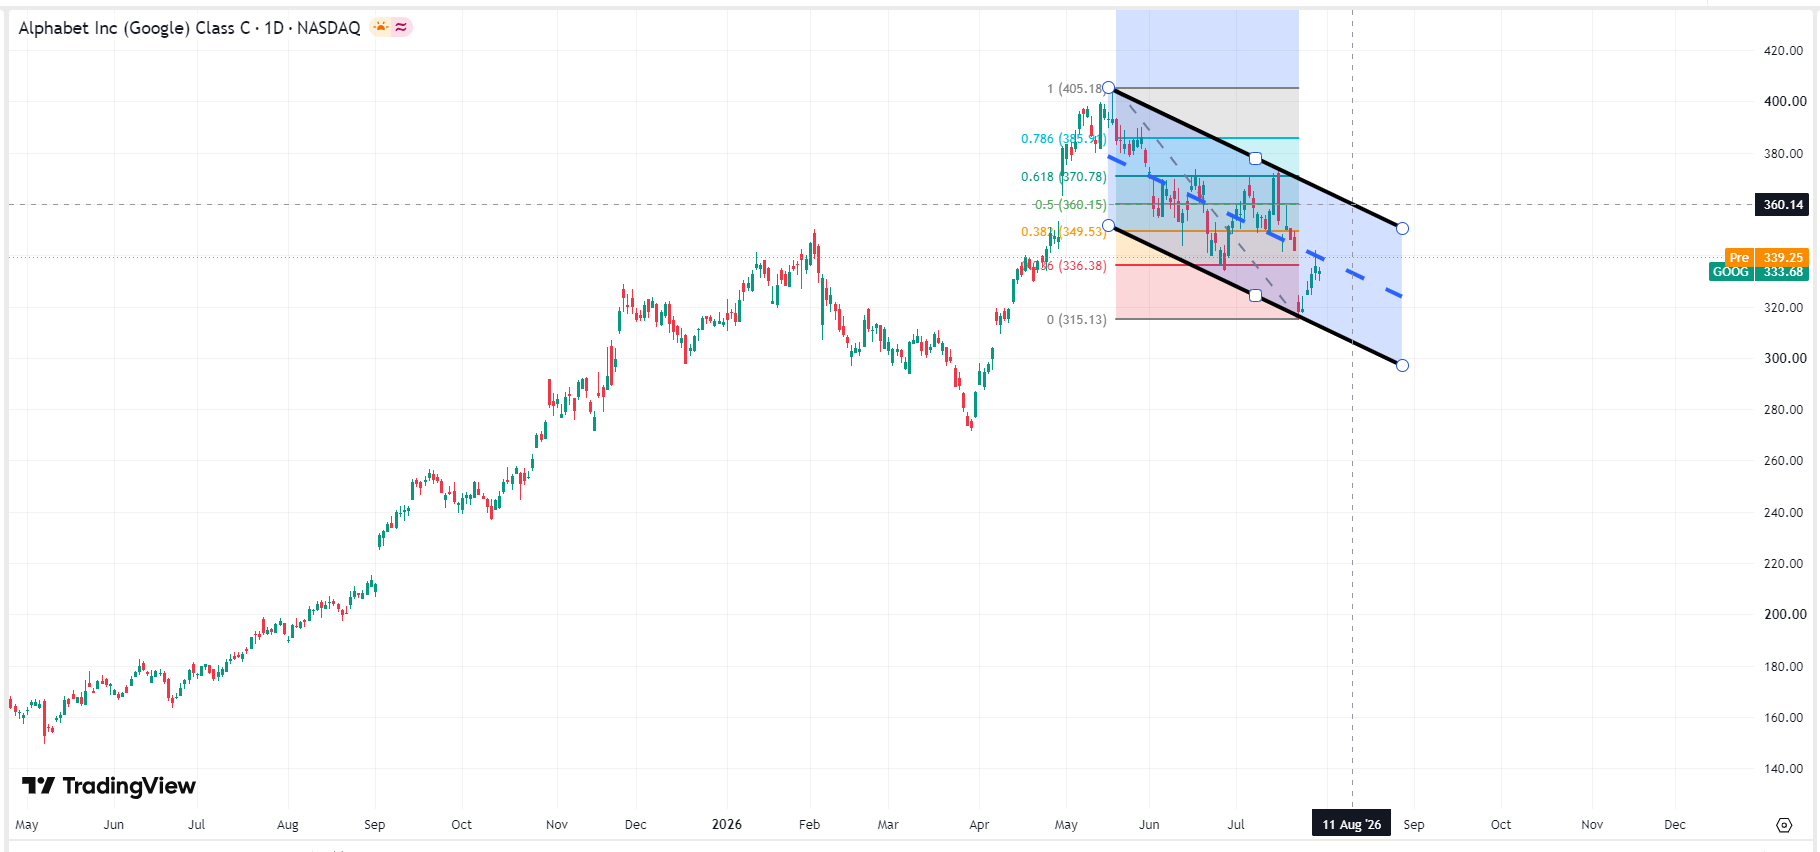 Google stock price chart, Source: TradingView
Find out more