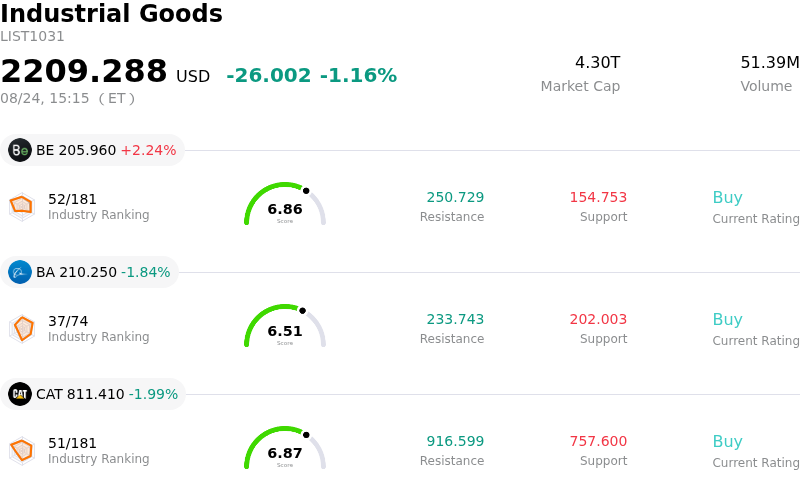
Howmet Aerospace Inc (HWM) moved down by 3.42%. The Industrial Goods sector is down by 1.16%. The company underperformed the industry. Top 3 stocks by turnover in the sector: Bloom Energy Corp (BE) up 2.35%; Boeing Co (BA) down 1.84%; Caterpillar Inc (CAT) down 1.99%.
What is driving Howmet Aerospace Inc (HWM)’s stock price down today?
Howmet Aerospace experienced a pullback and heightened intraday volatility as market participants engaged in profit-taking following a powerful multi-month rally. Although the company recently delivered strong second-quarter financial results that exceeded Wall Street estimates alongside an upward revision to its full-year revenue and earnings outlook, the stock’s valuation had stretched to elevated multiples relative to historical averages and industry peers. As the share price approached record levels, growing concerns over valuation premiums led institutional investors to lock in gains, generating downward pressure.
The decline was further amplified by technical factors as the stock broke below key short-term moving averages, triggering momentum-driven selling and automated technical exits. Technical indicators turning negative contributed to persistent intraday selling pressure. Additionally, while long-term demand across commercial aerospace, defense, and industrial gas turbine markets remains solid, investor attention has temporarily shifted toward the heavy capital expenditures required to expand production capacity and the extended lead times necessary before newly booked customer commitments fully ramp up.
Despite near-term volatility and multiple compression, Howmet Aerospace maintains robust structural tailwinds, backed by expanding aircraft backlogs, strong pricing power in next-generation engine components, and an active share repurchase program. However, short-term market sentiment remains constrained by elevated valuation expectations and position trimming within high-performing industrial equities, leaving the stock subject to consolidation.
Technical Analysis of Howmet Aerospace Inc (HWM)
Technically, Howmet Aerospace Inc (HWM) shows a MACD (12,26,9) value of -5.466, indicating a neutral signal. The RSI at 34.955 suggests neutral condition and the Williams %R at 99.309 suggests oversold condition. Please monitor closely.
Media Coverage of Howmet Aerospace Inc (HWM)
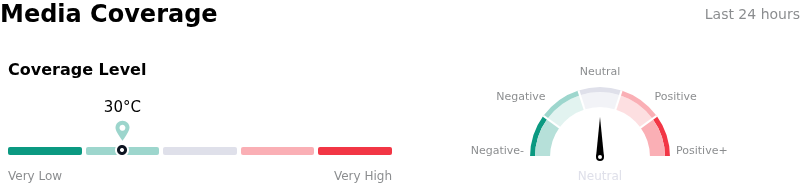
In terms of media coverage, Howmet Aerospace Inc (HWM) shows a coverage score of 30, indicating a low level of media attention. The overall market sentiment index is currently in neutral zone.
Fundamental Analysis of Howmet Aerospace Inc (HWM)
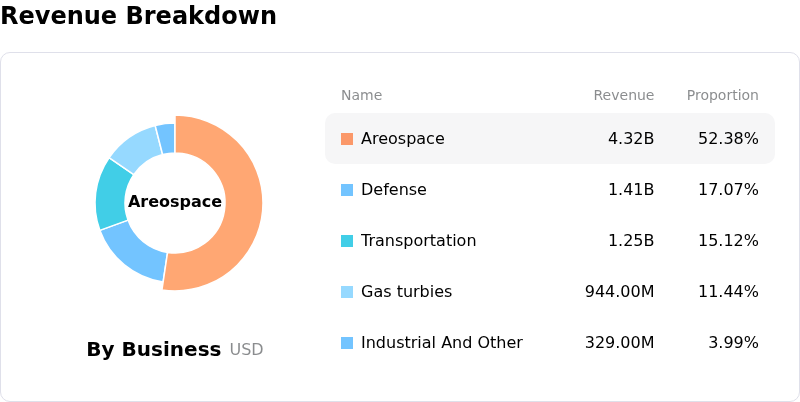
Howmet Aerospace Inc (HWM) is in the Industrial Goods industry. Its latest annual revenue is $8.25B, ranking 12 in the industry. The net profit is $1.51B, ranking 10 in the industry. Company Profile
Over the past month, multiple analysts have rated the company as Buy, with an average price target of $331.24, a high of $375.00, and a low of $214.92.
More details about Howmet Aerospace Inc (HWM)
Company Specific Risks:
- Valuation Overextension and Multiple Compression Vulnerability: Howmet Aerospace trades at a trailing price-to-earnings ratio exceeding 57x—substantially above the aerospace and defense industry median of 40x—leaving the equity highly susceptible to intraday profit-taking and multiple compression during periods of market-wide volatility.
- Capacity Ramp Lead-Time and Growth Lag: Despite increasing capital expenditures beyond $500 million in 2026, specialized machinery and tooling long lead times mean new production commitments initiated in August 2026 will not reach commercial output until late 2028, creating potential capacity bottlenecks if near-term delivery schedules accelerate.
- OEM Production Delivery and Supply Chain Exposure: The company's top-line commercial aerospace momentum remains directly tied to build rates and engine production schedules of major aircraft original equipment manufacturers (OEMs), exposing Howmet to immediate cash flow and volume risks if key OEM supply chains face technical delays or assembly halts.
- Sustained Insider Offloading and Technical Selling Pressure: Corporate insider disclosures highlight over $22.9 million in share sales over the past year with zero insider buys, fueling negative intraday momentum and profit-taking as the stock pulls back from recent peak levels near $310.
Find out more