TradingKey - BTC Plunges 3% Intraday as $84,000 Level Comes Under Threat; How Far Will This Pullback Go?
On September 24, Bitcoin (BTC) pulled back sharply from a high of around $87,000 to break below the $84,000 mark, falling to a low of $83,777 for a cumulative decline of roughly 3%. As of press time, Bitcoin's price has rebounded slightly to climb back above $84,000. Does this mean the pullback is over?
This pullback in Bitcoin prices was mainly driven by stronger-than-expected macroeconomic data. Yesterday, S&P Global data showed that the preliminary U.S. Composite Purchasing Managers' Index (PMI) for September climbed to 58.4, far exceeding the expected 55.3 and hitting its highest level since July 2021, indicating that the economy remains robust.
Positive economic data sparked market concerns that the Federal Reserve (Fed) might delay interest rate cuts or keep rates higher for longer, triggering a cross-market decline in risk appetite. Following the data release, U.S. Treasury yields rose to near 5.11%, while the high-interest-rate environment diminished the appeal of non-yielding risk assets like Bitcoin, putting downward pressure on prices.
After Bitcoin broke above $87,000, high-leverage positions chasing the rally surged rapidly. When prices began pulling back under the impact of macroeconomic data, a massive wave of stop-losses and forced liquidations was triggered among highly leveraged long positions. In the past 24 hours, $145 million in long positions were liquidated in the Bitcoin derivatives market, with liquidation sell orders further intensifying short-term downward pressure. In addition, Bitcoin prices had gained up to 16% since mid-September, and profit-taking by some investors temporarily exhausted buying momentum, prompting a technical pullback.
From a technical analysis perspective, Bitcoin prices may continue downward to retest $82,000-$83,000, which were the rebound highs in May and early September this year. On Monday, Bitcoin broke through this resistance level strongly with a large bullish candlestick, turning it into a solid line of defense that provides support for prices. However, if an unexpected heavy-volume breakdown occurs below this level, the bullish structure will be broken, returning to the wide range-bound consolidation seen over the past nine months.
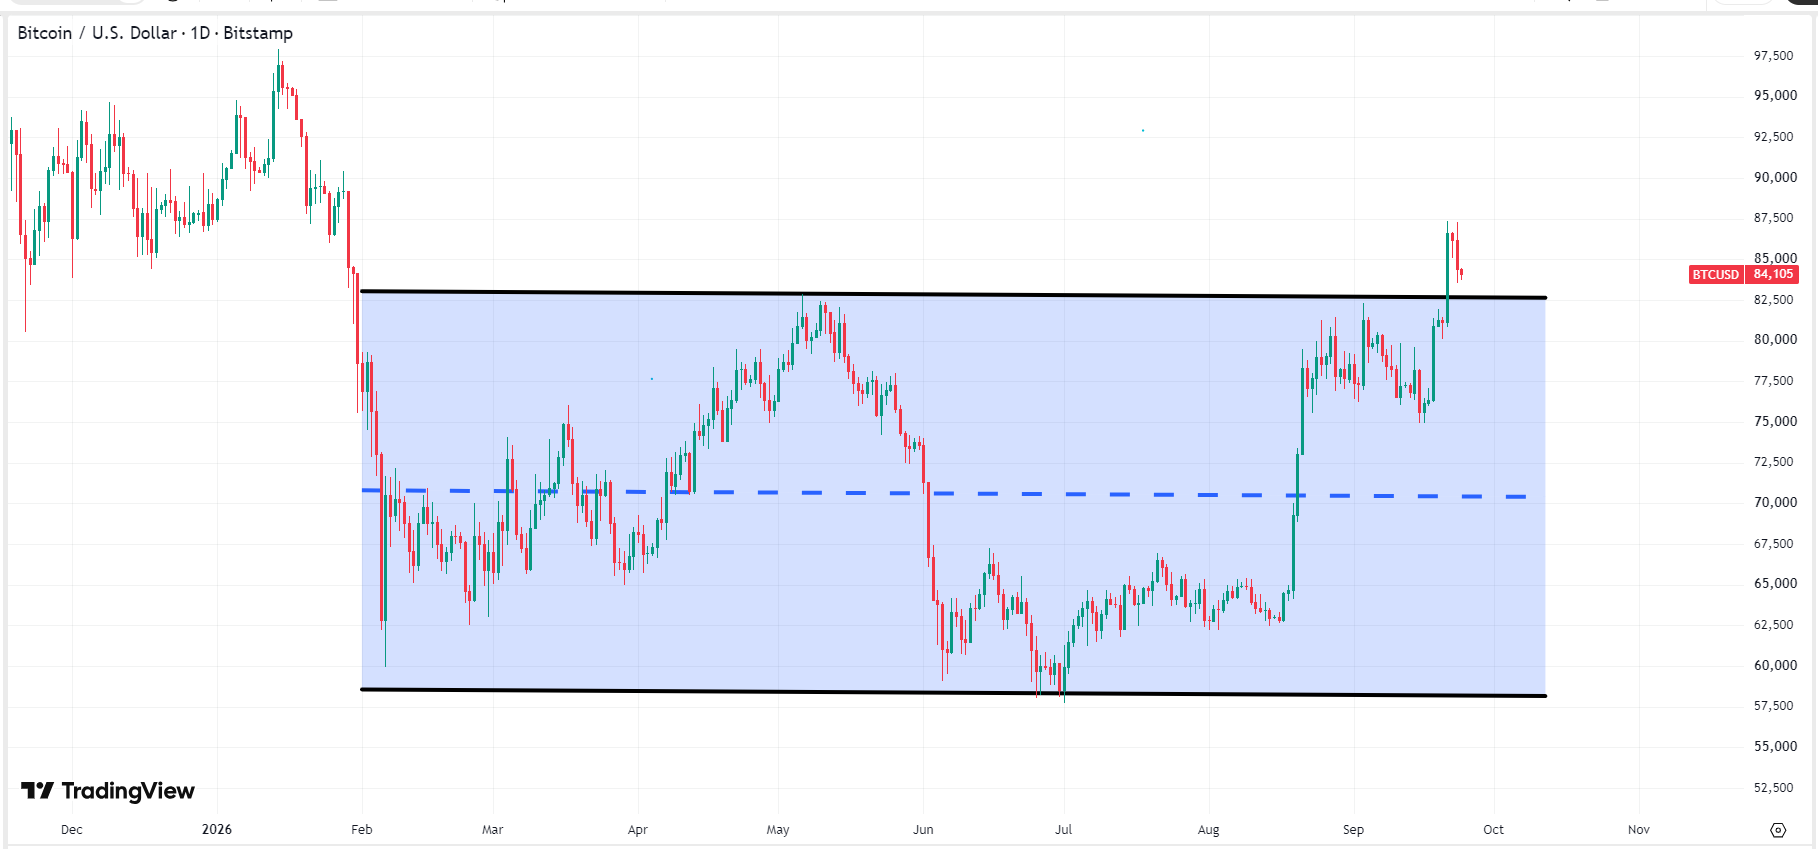 Bitcoin price chart, source: TradingView
Find out more