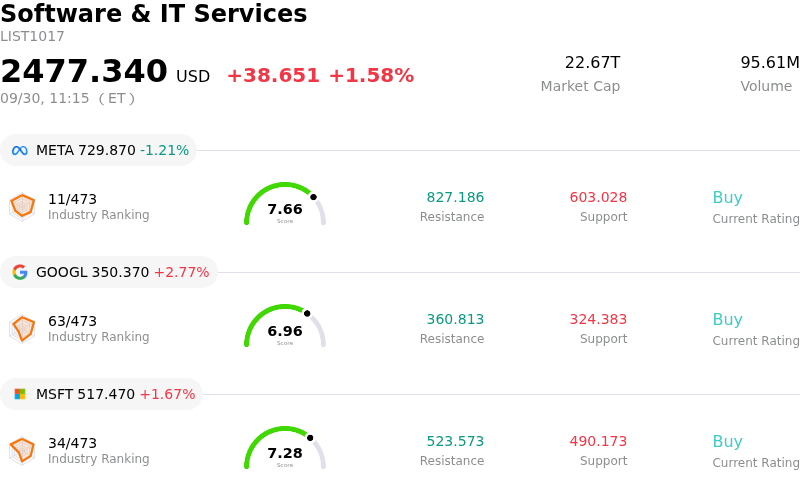
ServiceNow Inc (NOW) moved up by 3.28%. The Software & IT Services sector is up by 1.58%. The company outperformed the industry. Top 3 stocks by turnover in the sector: Meta Platforms Inc (META) down 1.21%; Alphabet Inc Class A (GOOGL) up 2.53%; Microsoft Corp (MSFT) up 1.67%.
What is driving ServiceNow Inc (NOW)’s stock price up today?
ServiceNow experienced positive upward momentum as buyers stepped in to capitalize on a recent valuation pullback across high-growth enterprise software names. Over preceding sessions, broader software equities faced headwinds from rising Treasury yields and competitive concerns in the enterprise software sector. However, the stock reversed course as market sentiment stabilized, drawing strong intraday demand from institutional investors recognizing an attractive entry point following the recent drawdown.
The underlying driver of investor confidence remains ServiceNow's solid positioning as a core enterprise workflow platform integrating agentic artificial intelligence capabilities. Recent highlights, including its inclusion in major AI rankings, strategic security partnerships to support enterprise governance, and increasing adoption of its EmployeeWorks and Now Assist solutions, continue to reinforce its long-term growth story. Analysts have highlighted that enterprise demand for automated workflow software remains resilient, insulating the company from broader macro volatility.
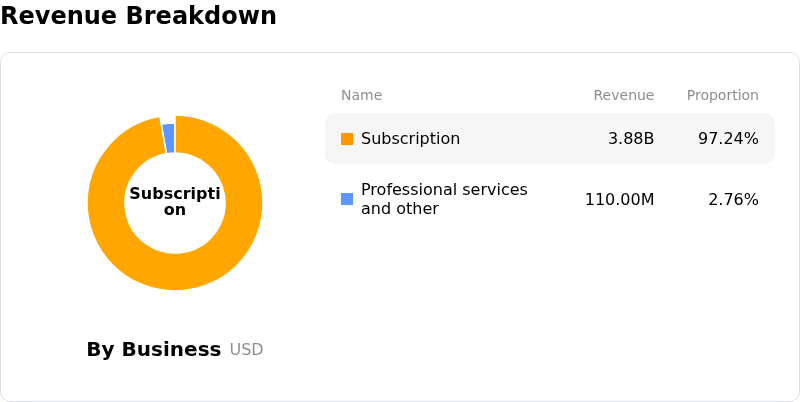
From a fundamental perspective, solid operating results featuring robust subscription revenue expansion and expanding performance obligations continue to underpin the bull thesis. Wall Street research firms maintain largely favorable ratings and target price revisions, noting that the company is expanding top-line sales faster than peer software majors. Despite ongoing debates regarding valuation multiples across tech software, the trading action reflects a strong vote of confidence in ServiceNow's capacity to monetize enterprise AI adoption while demonstrating durable financial performance.
Technical Analysis of ServiceNow Inc (NOW)
Technically, ServiceNow Inc (NOW) shows a MACD (12,26,9) value of -2.943, indicating a neutral signal. The RSI at 50.613 suggests neutral condition and the Williams %R at 63.641 suggests sell condition. Please monitor closely.
Media Coverage of ServiceNow Inc (NOW)
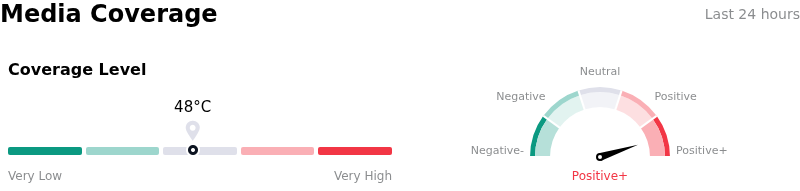
In terms of media coverage, ServiceNow Inc (NOW) shows a coverage score of 48, indicating a moderate level of media attention. The overall market sentiment index is currently in extremely bullish zone.
Fundamental Analysis of ServiceNow Inc (NOW)
ServiceNow Inc (NOW) is in the Software & IT Services industry. Its latest annual revenue is $13.28B, ranking 28 in the industry. The net profit is $1.75B, ranking 30 in the industry. Company Profile
Over the past month, multiple analysts have rated the company as Buy, with an average price target of $149.04, a high of $248.00, and a low of $72.00.
More details about ServiceNow Inc (NOW)
Company Specific Risks:
- Workforce Reductions and Execution Risks: Operational friction has increased following the September 28 effective date for WARN Act layoff notices involving 287 California employees across San Diego and Santa Clara, heightening near-term execution risk as management restructures its internal talent base toward AI-focused capabilities.
- AI-Driven Disruption to Seat-Based Revenue: Persistent market anxiety surrounding agentic AI tools continues to cloud long-term revenue visibility, with investors concerned that autonomous enterprise workflow automation will reduce human seat count requirements and erode traditional per-seat subscription models.
- Intensified Enterprise Competition: ServiceNow faces expanding competitive overhang as major technology giants deploy competing enterprise workflow platforms, threatening ServiceNow's pricing leverage and market share dominance in enterprise automation.
- Elevated Valuation Multiple Vulnerability: Trading at a premium price-to-earnings ratio above 80x, the stock remains highly susceptible to severe intraday multiple compression whenever macroeconomic volatility or rising Treasury yields trigger broad risk-off selloffs across software equities.
Find out more