BNB (BNBUSD) is down 1.13% at Oct 6 02:05(ET), now at $776.9, with a 7-day up of 2.76%.
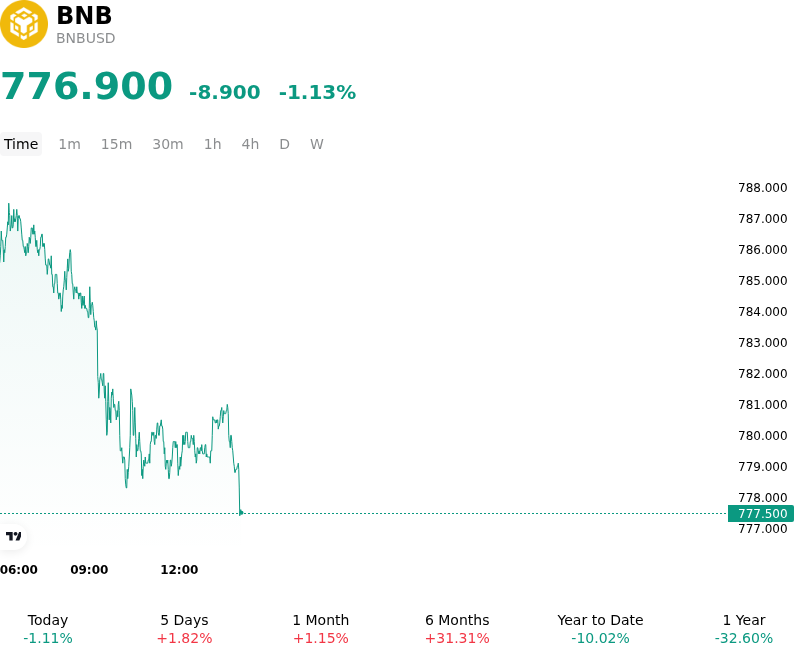
What is driving BNB (BNBUSD)’s stock price down today?
The downward pull in BNB was primarily driven by a technical rejection at key overhead resistance near the psychological 800 level, triggering short-term profit-taking and derivative leverage unwinding. After briefly pushing above this structural ceiling, spot capital flows lacked the sustained momentum necessary to establish a firm support floor. As liquidity thinned around the multi-month high, automated sell orders and long liquidations pushed prices lower across major derivatives exchanges.
From a protocol perspective, market participants are anticipating the upcoming 37th quarterly BNB auto-burn scheduled for mid-October. However, because the protocol's supply reduction mechanism is programmatic and widely understood, the event is largely priced into existing valuations rather than acting as a fresh catalyst for spot demand. While long-term ecosystem fundamentals remain anchored by network activity and growth in tokenized real-world assets on BNB Chain, near-term price action remains constrained by technical range limits and positioning rebalancing.
The broader macroeconomic environment also weighed on risk appetite across digital assets. Institutional investors adopted a cautious stance ahead of incoming US economic data, leading to temporary risk-off repricing and reduced leverage exposure. Firm yields in fixed-income markets and tight market liquidity restricted risk-on capital flows, leaving major Layer-1 tokens sensitive to intraday momentum shifts. As a result, the intraday decline reflects a standard technical consolidation and leverage shakeout following a failed breakout attempt, rather than a deterioration in network adoption expectations.
Technical Analysis of BNB (BNBUSD)
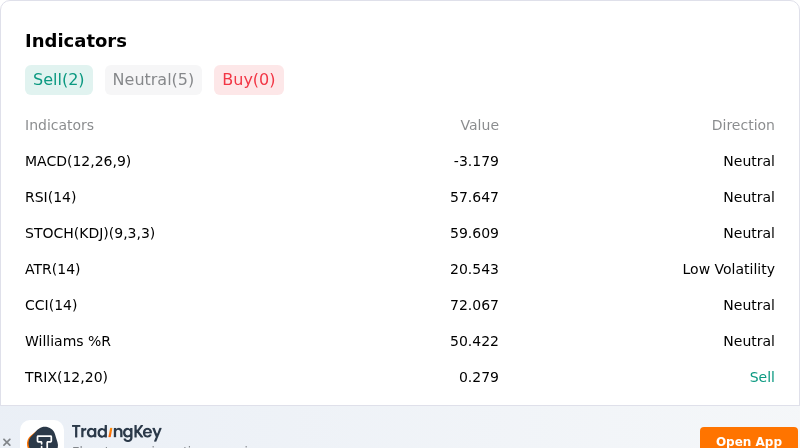
Technically, BNB (BNBUSD) shows a MACD (12,26,9) value of -3.179, indicating a neutral signal. The RSI at 57.647 suggests neutral condition and the Williams %R at 50.422 suggests neutral condition. Please monitor closely.
More details about BNB (BNBUSD)
Recent Events and Risks:
- Technical Overhead Resistance and Rejection Risk: BNB faces strong seller absorption near the critical $800–$807 resistance ceiling; failure to cleanly convert $800 into sustained support risks triggering a technical breakdown toward underlying support levels at $758 and $720.
- Leveraged Long Accumulation and Liquidation Vulnerability: BNB futures open interest has climbed near multi-month highs alongside positive funding rates, reflecting heavy leveraged long positioning that leaves the market vulnerable to sharp long liquidation cascades if price slips below key support triggers.
- European Regulatory Scrutiny and Legal Overhang: Ongoing scrutiny by European regulators regarding Binance's legal compliance and operational footprint under MiCA regulations continues to maintain a regulatory risk discount, dampening broad institutional capital allocation.
- Subdued Spot Demand and On-Chain Activity Cooling: While derivatives positioning remains active, spot exchange-traded fund (ETF) flows for BNB remain quiet and decentralized exchange (DEX) volume on BNB Chain has periodically cooled, leaving spot order books thinner during sudden sell-offs.
Find out more