Why Has the Stock Market Avoided Sustained Declines Despite a Sharp Oil Price Surge?
According to Trader Chase Desk, on May 7, Citi Global Macro Strategy released its latest research report interpreting this perplexing market phenomenon, stating that the trend is not abnormal; instead, artificial intelligence has reshaped market rhythm.
This round of oil price shocks is traced back to March 6
Analysts pinpoint March 6, 2026, as the starting point of the current oil price shock cycle.
The judging criteria are clear: Brent crude futures surged by more than 40% cumulatively within three months, while maintaining a positive average cumulative gain over the subsequent 100 trading days — defined as a sustained oil price shock.
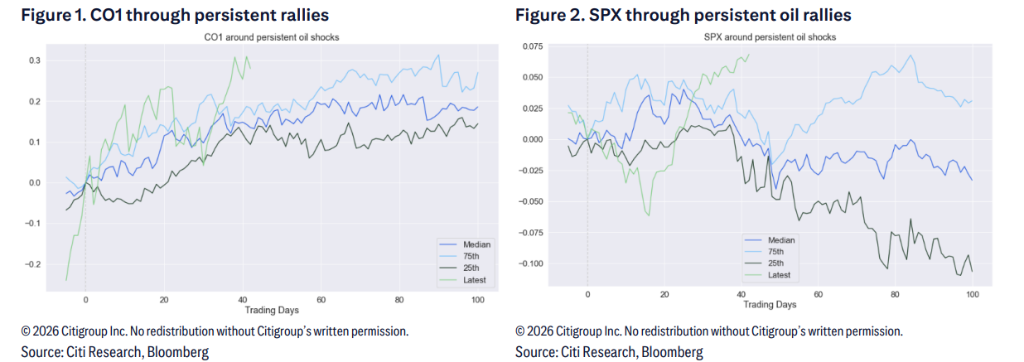
Looking back at history, every occurrence of a sustained oil price rally of this magnitude follows a fixed cross-asset transmission logic: rising oil prices → climbing interest rates → tightening financial conditions → downward pressure on equities.
Historical data shows that during past sustained oil price shocks, U.S. equities typically fell continuously for around 50 days before entering a consolidation and bottoming phase.
The Current Divergence: Sharp Selloff Followed by an Even Faster Rebound
Historically, equities would slide for roughly 50 days before bottoming out, yet the current market trajectory deviates notably from this pattern.
Oil prices keep edging higher, while U.S. stocks staged a sharp selloff followed by a rebound far outpacing the historical average. The report attributes the accelerated bottoming process to AI-driven market optimism.
Specifically, hyperscale tech corporations are leading the S&P 500 higher. Market reactions to tech earnings further validate this trend: investors remain willing to buy into tech stocks as long as rising AI capital expenditure translates into higher revenue growth.
Consequently, the S&P 500 can maintain an uptrend even amid renewed oil price rallies. The robust AI thematic momentum underpins tech stock leadership despite persistently elevated crude prices.
Historical Pattern: Equity-Oil Correlation Reverses Amid Prolonged High Oil Prices
This stands as the core insight of the report.
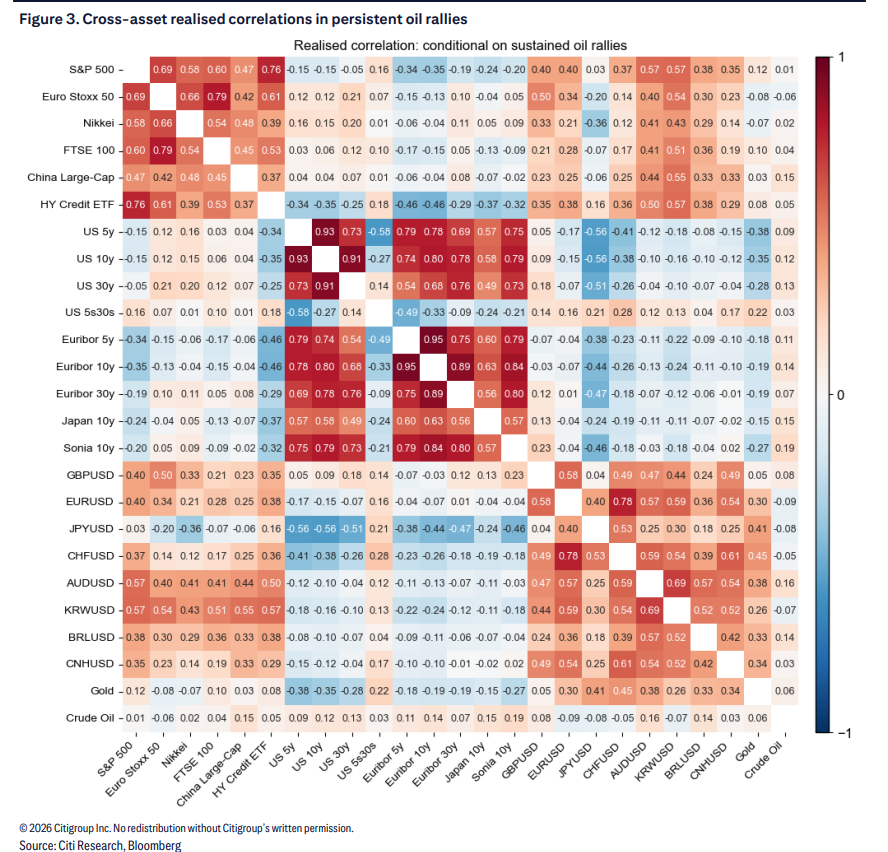
After sorting out cross-asset correlation data during all historical sustained oil price shocks, analysts reached a pivotal conclusion:
In the early stage of an oil price shock, equities and crude oil exhibit a negative correlation (oil up, stocks down). As the shock persists, this negative correlation gradually fades and even shifts to a mild positive correlation, resulting in a synchronized rally of stocks and oil.
The underlying logic is straightforward: the maximum market damage from an oil price shock is concentrated in the initial phase, marked by rapid interest rate hikes, abrupt financial condition tightening, and forced market repricing. Once this adjustment phase concludes, markets gradually look past elevated oil prices, allowing risk assets to reset valuations.
Data further indicates key correlation shifts during periods of sustained high oil prices:
The correlation between global equities and U.S. Treasury yields flips from negative to positive, covering European equities, Japanese stocks and Chinese equities alike.
The positive correlation between U.S. Treasury yields and oil prices weakens materially.
The correlation between the 5Y-30Y U.S. Treasury yield curve and oil prices also turns positive, signaling a shift from bear flattening to curve normalization.
Market Mispricing Unlocks Trading Opportunities for Citi
By comparing the implied market correlations with the theoretical correlations implied by historical patterns, analysts identified notable valuation mispricing.
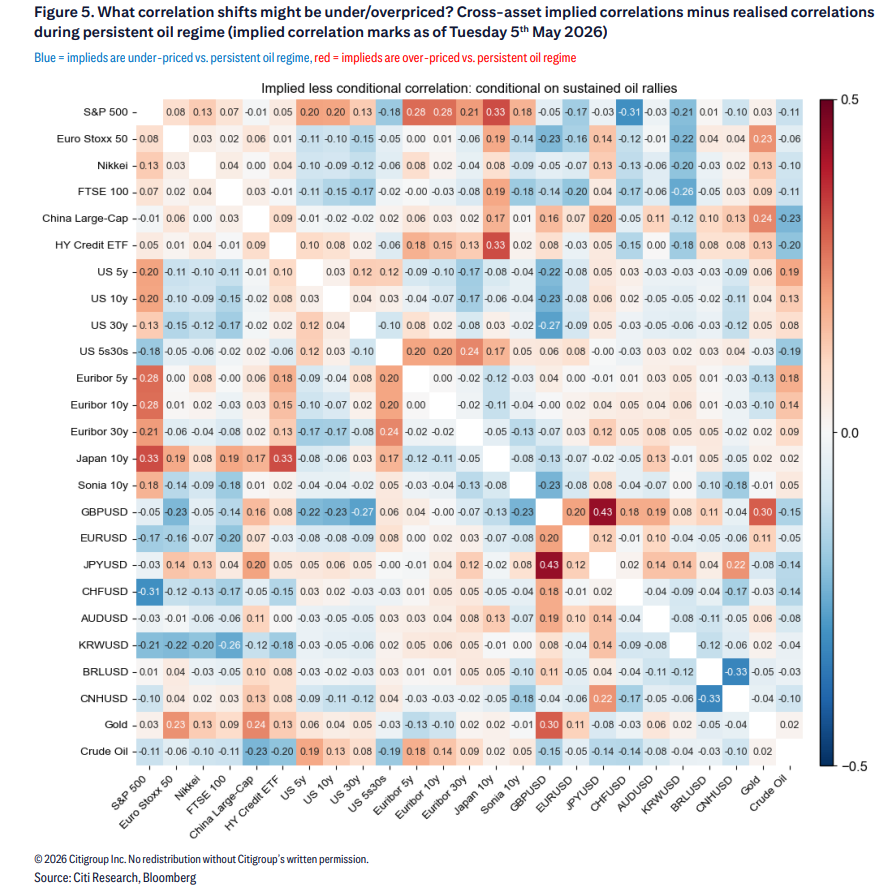
Three core mispricing anomalies stand out:
Underestimated Equity-Oil Correlation
The current 6-month implied correlation between stocks and oil stands at -10%, reflecting lingering market bets on the traditional oil-up-stocks-down dynamic. However, historical patterns suggest this negative correlation will fade or even turn positive, pointing to clear market underpricing.
Underestimated 5s30Y Curve-Oil Correlation
Market pricing implies a negative correlation between the 5-year/30-year Treasury yield curve and oil prices, while historical trends indicate the correlation will turn positive as the oil price shock endures.
Overestimated High-Yield Bond (HYG)-Interest Rate Correlation
Citi’s Quantitative Macro team notes that credit spreads are usually the first risk assets to buckle amid a severe stagflation scenario. Markets have fully priced in a negative correlation between high-yield bonds and oil prices.
Betting on Synchronized Equity and Oil Gains
Against this backdrop, Citi has established a new trading position:
Purchase a Dual Digital option expiring on August 17, 2026, with two trigger conditions: the S&P 500 trades above 106.25% (equivalent to 7,833.29 points) and CLU6 crude oil futures rise above 110% (equivalent to $91.19 per barrel). The premium accounts for 7.5% of the notional principal, set at $2 million, with a maximum loss capped at $150,000.
Reference pricing (as of 14:43 London Time, May 7, 2026):
S&P 500 spot: 7,372.50 points; CLU6 crude oil futures: $82.90 per barrel.
The trade logic is clear: if the equity-oil correlation reverts from negative to positive in line with historical norms, the market has underpriced the probability of a synchronized rally, making the Dual Digital option relatively undervalued.
The bank added that it prefers expressing this macro theme via the "S&P 500 upside + oil price rally" trade, rather than directly trading curve-oil correlation. The rationale lies in higher conviction over U.S. equity upside versus relatively lower certainty of a steepening Treasury yield curve.
Notably, the report explicitly highlights key risks: the primary downside risk stems from the persistence of negative correlation between oil prices and the S&P 500.
Strait of Hormuz: Structural Support for Sustained Elevated Oil Prices
The fundamental backdrop for prolonged high oil prices hinges on the Strait of Hormuz. Even amid diplomatic negotiation progress, upside risks to crude prices remain intact:
A prolonged closure of the strait would trigger continuous declines in global oil inventories, delivering convex upward shocks to oil prices.
Even with a gradual reopening of the waterway, inventory normalization will take considerable time, keeping global oil supply structurally tight.
As such, substantive risks of prolonged high oil prices remain even if a diplomatic agreement is reached.
This forms the foundational premise of the analytical framework: oil prices are unlikely to retreat quickly, rendering historical cross-asset correlation patterns highly referential for current market pricing.