PFFA: Preferred ETF With Over 9% Yield And Potential For Appreciation
Khanchit Khirisutchalual
Introduction:
The Virtus InfraCap U.S. Preferred Stock ETF (NYSEARCA:PFFA) is an ETF (Exchange-Traded fund) and was incepted in May 2018. So as such, it has a short history of 6 years, and that makes it difficult to analyze its future. The fund primarily invests in a portfolio of preferred securities issued by U.S. companies that have a market capitalization of at least $100 million. The primary objective of the fund is to provide high current income, and capital appreciation is the secondary objective. The fund is an actively managed fund and maintains a modest leverage of 20-30% to achieve its objectives. The 30-day SEC yield is 8.85%, while the current yield is 9.09%.
As per the fund's prospectus, "Under normal market conditions, the Fund will invest not less than 80% of its net asset (plus the amount of any borrowings for investment purposes) in U.S. preferred stock, and in derivatives and other instruments that have economic characteristics similar to such investments. The Fund's portfolio will primarily consist of preferred stock issued by companies with market capitalizations of over $100 million, which may include small and mid-capitalization companies.
Infrastructure Capital Advisors, LLC, the Fund's sub-adviser (the "Sub-Adviser"), may purchase and write put and call options in an effort to generate additional income, reduce volatility, and/or hedge against market or other risks in the Fund's portfolio.
The Sub-Adviser actively manages the Fund's assets pursuant to a variety of quantitative, qualitative, and relative valuation factors. The Sub-Adviser will typically evaluate potential investments with respect to certain key variables that the Sub-Adviser believes make a business successful over time, including, without limitation, a company's competitive position, its perceived ability to earn a high return on capital, the historical and projected stability and reliability of its profits, its anticipated ability to generate cash in excess of its growth needs and its access to additional capital. In addition, when selecting preferred stocks that are subject to a call provision, the Sub-Adviser generally seeks to underweight or eliminate those that trade above the call price and exhibit a low or negative yield-to-call (i.e., the rate of return that an investor would earn if the preferred stock was held until its call date)."
Other salient features of this fund are as follows:
- Virtus ETF Advisers LLC is the Fund's investment adviser. However, they have engaged sub-advisors, Infrastructure Capital Advisors ("InfraCap"), who are responsible for all investment decisions, subject to the supervision of the Advisor. InfraCap is a New York-based investment management firm specializing in energy infrastructure, real estate, and option-enhanced income strategies. InfraCap was founded in 2012 and offers a series of exchange-traded funds and hedge funds to both individual investors and institutions.
- This fund uses 20-30% leverage. As most readers are aware, the leverage can work both ways. The use of leverage can increase the total returns when the values of the underlying assets are increasing but can also have the opposite effect when the asset values are in decline. Leverage can also make a fund more volatile than it would be otherwise. During a high interest-rate environment, leverage would add a lot of additional interest burden that can eat into investors' returns. With lower interest rates on the horizon, leverage may be less of an issue.
- The fund intends to pay nearly all of its net investment income, and any realized capital gains as distributions throughout the year. Distributions are paid monthly and mostly the same amount every month. However, the fund can change the amount at any time to balance out the amount paid and earned as NII plus realized capital gains. Currently, it is paying $0.1675 a share monthly, amounting to $2.01 on an annual basis.
- The fund is a U.S. domestic fund and invests entirely in securities issued by U.S. companies.
- It is a reasonably diversified fund with a total of 187 positions, with top 10 holdings accounting for nearly 28% of the total assets.
- As of Sep. 09, 2024, the fund had roughly $1.2 billion worth of net assets. We could not find the precise current leverage, but the leverage stood at roughly 22% as of Apr. 30, 2024.
- The fund is actively managed and has a management fee of 0.80%. The current total expense is 2.52%, which includes the management fee, other operating expenses, and the interest expense on leverage.
- As of Sep. 09, 2024, its distribution yield on the market price was 9.09% and 9.12% on NAV. Being an ETF, the market price and the NAV are usually very close.
Financial Outlook:
Let's look at the Fund's Financial health and performance. The most recent detailed report that is available to investors is the semi-annual report ending on Apr. 30, 2024, and the previous year's annual report for the period ending Oct. 31, 2023.
Net Investment Income:
The net investment income (or NII in short) is the net income that a fund earns from its investment in the form of dividends, distributions, and interests or derivatives like options, minus all of the fund's expenses, including management fees, operating expenses, commissions, and interest on leverage. For equity-based funds, especially in high-growth sectors like technology, the NII is not very relevant. However, for fixed-income funds like PFFA or bond funds, it is very relevant.
Here is what it looks like in terms of NII, Distributions, and Net Assets at the beginning and end of the statement period.
(all amounts are in US $ (except Shares Outstanding) for the 6-month period ending on Apr. 30, 2024, and the previous year's 12-month period ending on Oct. 31, 2023. The negative amounts are shown inside parentheses.
Table-1:
Author (Data source: PFFA's 2024 Semi-annual and 2023 annual report)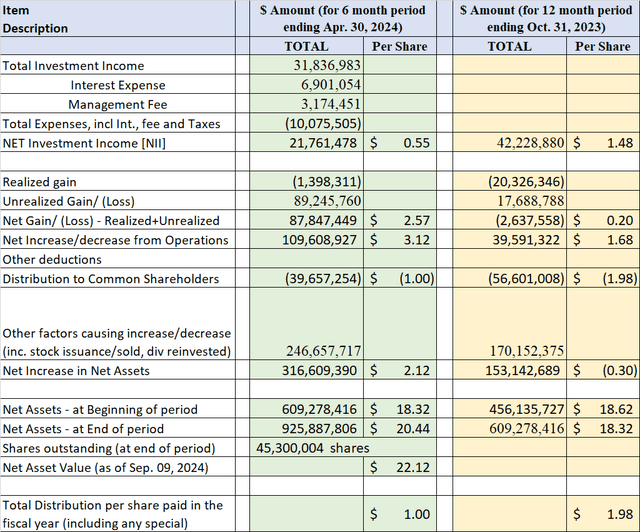
Distributions:
The Fund aims to distribute substantially all of its net investment income and net realized capital gains (paid on a monthly basis). Any excess gains, if any, are paid annually. The Fund may distribute such income dividends and capital gains more frequently, if necessary, in order to reduce or eliminate federal excise or income taxes on the Fund and to qualify as a regulated investment company. So, the amount of distributions can vary from year to year. Generally, distributions can be reinvested automatically in additional whole shares (subject to the broker's availability of such an option).
The fund has paid distributions since inception, and after a nearly 20% reduction during the 2020 pandemic, it has increased the distribution amount every year since. It is currently paying $0.1675 per share, which amounts to $2.01 annually. It also paid some extra special distribution in 2019 at the end of the year.
So, is the distribution covered?
PFFA assets are mostly preferred securities. Due to the nature of these securities, the Fund generates substantial investment income. However, after meeting all its expenses and interest on leverage, the net investment income covers most of the distributions but does not always cover all of the distributions. The table below provides a detailed look at how much of the distributions were historically covered by the NII and capital gains. So, a small part of the distributions (only about 7%) were paid from the realized capital gains between the 2019-2023 financial years. Also, a very small portion of under 5% was paid as ROC (return of capital) during this period of five years.
Table-2: Distribution Data (Years 2019-2023)
Author (Source: Fund's Annual Returns)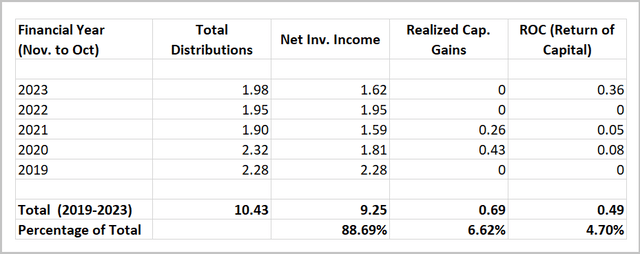
Note: The above table is based on the data provided in the annual reports. Since the company's financial year is different than the calendar year, the reported figures are unlikely to match the fund's year-end tax statements.
Based on what we see in the above table, we can clearly give a vote of confidence to the management on distribution sustainability.
Discount/Premium:
This fund is an ETF (exchange-traded fund), and the NAV is calculated on a daily basis. Usually, the market price trades very close to the NAV (net asset value). The premium on 09/09/2024 was less than 0.32%. The 30-day bid/ask spread is low at < 0.05%, and the daily trading volume is roughly in the range of 500,000 shares.
Funds Holdings:
Chart-1: Holdings as of 09/10/2024
Source: PFFA website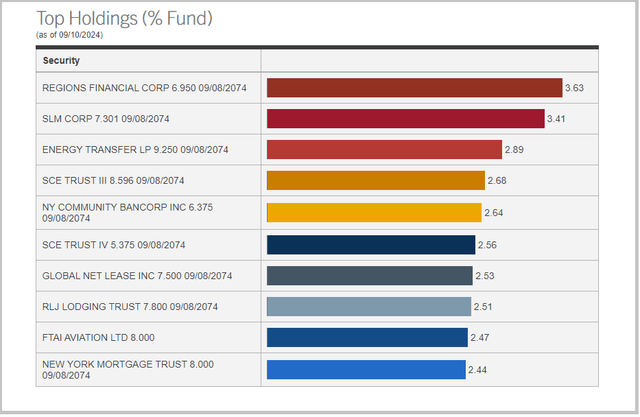
As of Apr. 30, 2024, the fund had 187 positions, with nearly all of them in preferred securities (except one small equity position). The top 10 positions accounted for nearly 28% of the total assets. As expected, the largest three sectors in the fund are financials, real estate, and REITS-mortgage, accounting for roughly 28%, 23%, and 19%, respectively.
The top holdings and asset composition as of Jun. 30, 2024, are presented below.
Table-3: Sector Allocations as of 06/30/2024
Source: Fund's fact sheet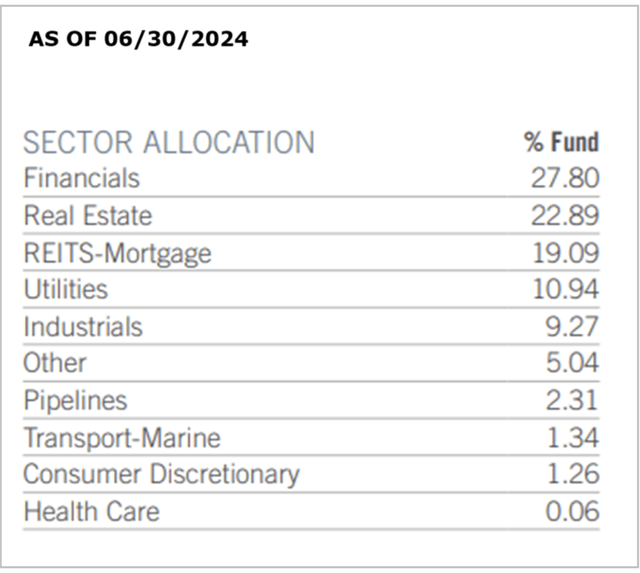
Performance and Valuation:
Chart-2:
Source: PFFA website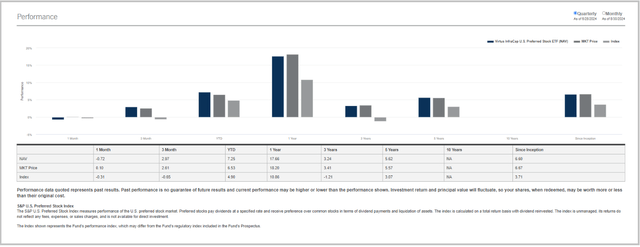
Let's compare our fund with one of the largest preferred ETF funds, iShares Preferred & Income Securities ETF (PFF). PFF seeks to track the investment results of the ICE Exchange-Listed Preferred & Hybrid Securities Index, so in that sense, it is a passive fund. First, when we look at the price chart, we don't see much difference between PFF and PFFA; both funds move up or down in a similar fashion in various time frames. However, if we look at the total-return chart, we can see a wide difference in results. We can observe that PFFA, which uses leverage and has active management, is more volatile but also provides much better returns in the long term.
Chart-2B: Price chart of PFFA and PFF
YCharts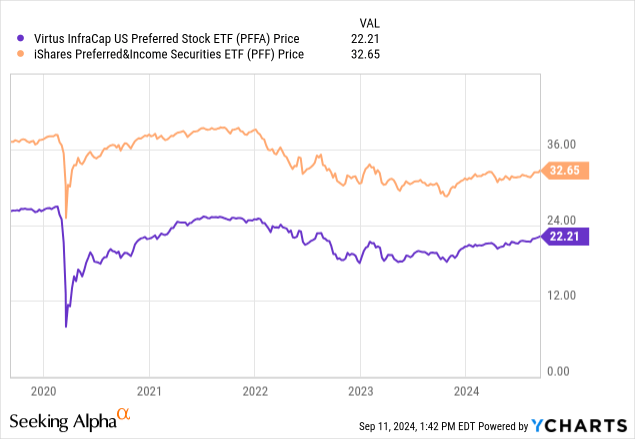
Chart-2C: Total-return chart of PFFA and PFF
YCharts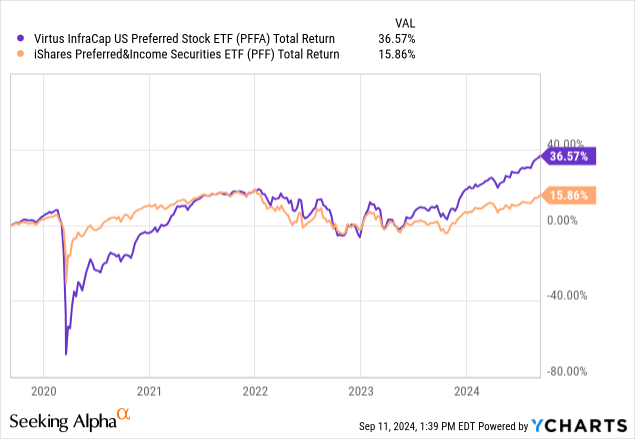
Now, let's add two more preferred funds for comparison: Flaherty & Crumrine Pref. & Inc. Fund (FFC), and Nuveen Preferred & Inc Opportunity Fund (JPC). FFC and JPC are both closed-end funds, and both use very high leverage in the range of 35% plus.
Chart-2D: Total-return chart of PFFA, PFF, FFC, and JPC
YCharts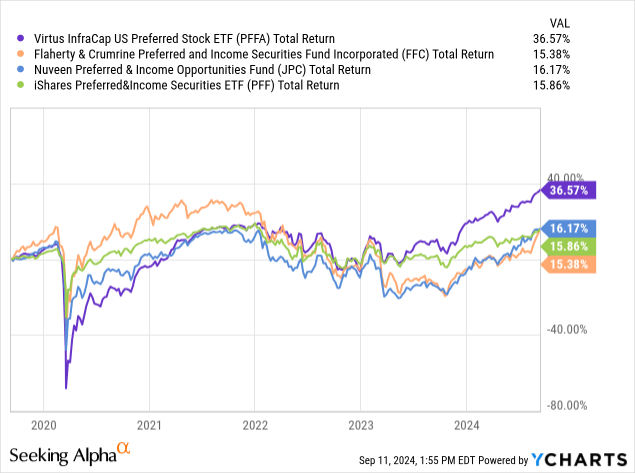
Data by YCharts
The table below provides a comparison of various metrics of these four funds over various time frames.
- Virtus InfraCap U.S. Preferred Stock ETF
- Flaherty & Crumrine Pref. & Inc. Fund (FFC)
- Nuveen Preferred & Inc Opportunity Fund (JPC)
- iShares Preferred & Income Securities ETF (PFF)
- SPDR S&P 500 ETF Trust (SPY).
Table-4: (Data - period as specified, if not specified then as of Aug. 31, 2024)
Item Desc. | PFFA | FFC | JPC | PFF | S&P 500 |
Dividend Yield% (as of 08/20/2024) | 9.09% | 6.60% | 10.11% | 6.18% | 1.25% |
Annualized Return [CAGR] From Jan. 2019 - Aug. 31, 2024. | 9.80% | 6.42% | 6.94% | 4.49% | 10.06% |
Max. Drawdown Jan. 2019 - Aug. 2024. | -51% | -36% | -29% | -20% | -24% |
Std. Deviation Jan. 2019 - Aug. 2024. | 29.6% | 20.5% | 19.5% | 12.5% | 17.7% |
3-Year CAGR NAV | 4.95% | -4.80% | -0.02% | -0.86% | 9.22% |
1-Year CAGR NAV | 21.13% | 26.10% | 31.57% | 12.24% | 26.95% |
Discount/Premium | +0.32% | -4.85% | -3.55% | n/a | n/a |
Fees (excluding interest) | 0.80% | 0.98% | 1.58% | 0.46% | 0.09% |
Leverage | 20% - 30% | 38% | 37% | 0% | 0% |
No of holdings | 187 | 238 | 310 | 446 | 504 |
Assets (Total AUM) | $1.2 Billion | $1.3 Billion | $4.1 Billion | $14.9 Billion | $551 Billion |
Allocation | Preferred Securities ETF (With Leverage) | Preferred Securities ETF (With Leverage) | Preferred Securities ETF (With Leverage) | Preferred Securities ETF (With no Leverage) | Largest 500 US companies |
Note: Some of the data (e.g., number of holdings and leverage) may not be current).
Risk Factors:
Investors need to be aware of certain risk factors that will likely apply to this fund. Risk factors could be summarized as follows:
- Sector risk: PFFA primarily invests in U.S. preferred securities. Even though it is diversified, it is still concentrated in sectors like Financials, Real estate, and Utilities. If any or all of these sectors were to face some kind of downturn, the net asset value of the fund would take a beating as well.
- Interest rates risk: The preferred securities sector is quite sensitive to the direction of the interest rates. When the interest rates rise, the asset value of these securities tends to decline, while the reverse happens when the rates are declining. Now that the rates are set to decline from hereon, asset values of this fund have risen recently, and some of the upside is already priced in.
- Leverage risk: PFFA uses 20% to 30% leverage. The leverage carries an interest burden, and that can be significant during a high-rate environment. The leverage also helps inflate the returns when asset values are rising, but the reverse is true when the asset prices are falling. Leverage can also force an ETF to liquidate its positions at an unfavorable time, causing permanent losses. Generally, leverage would make a fund more volatile compared to a similar fund with no leverage.
- Preferred securities risk: The preferred securities are hybrid kinds of securities. Their values rise in a smaller proportion when the issuing company's common stock rises, as well as vice versa. On the other hand, they are fixed-income securities that come after the bonds in terms of seniority.
- The general risks such as the geopolitical situation.
- Market risks: With the recent market volatility, there is a renewed fear and possibility of the occurrence of a recession in early or mid-2025. A significant correction in the broader market remains a real risk.
Concluding Thoughts:
The expectation of declining interest rates has lifted the valuations of most fixed-income securities, including preferred securities. So, some of the upsides in PFFA valuations have already been realized and built into the price. However, more than likely, we are not done yet. Depending on how aggressively the Fed cuts the rates in 2024 and early 2025 will determine the further bounce (or lack of it) in the valuations of funds like PFFA. This fund currently yields 9.09%, which is very attractive. Even a small appreciation in the valuations will make this fund an attractive investment. Obviously, it does not come without risks, and we have outlined them in the 'Risks' section above.
Our purpose in this article is not to provide a buy or a sell recommendation, but to give enough information to readers to decide for themselves if this fund would make sense for their investment portfolio. We think it is a compelling investment right now for income investors and retirees. However, highly conservative investors who prefer to avoid leverage may look at PFF, which has zero leverage and lower fees, and yields over 6%. However, PFF also comes with the disadvantage of passive index-based management and possibly lower returns.
免責聲明:投資有風險,本文並非投資建議,以上內容不應被視為任何金融產品的購買或出售要約、建議或邀請,作者或其他用戶的任何相關討論、評論或帖子也不應被視為此類內容。本文僅供一般參考,不考慮您的個人投資目標、財務狀況或需求。TTM對信息的準確性和完整性不承擔任何責任或保證,投資者應自行研究並在投資前尋求專業建議。
熱議股票
- 1
- 2
- 3
- 4
- 5
- 6
- 7
- 8
- 9
- 10