Shiba Inu (SHIB) New Key Pattern Just Dropped, Anemic XRP Performance Might End Here, Dogecoin (DOGE) Price Reversal Imminent?
The price chart of Shiba Inu has formed a symmetrical triangle, signifying a period of consolidation. Volume has been gradually declining as the price has stabilized, as the volume profile shows. This is a typical characteristic of this pattern.
Although symmetrical triangles are generally neutral patterns, when an asset breaks out of the triangle, the price of the asset frequently moves significantly. In the instance of SHIB, two major outcomes are possible:
SHIB may see an upside breakout if there is an abrupt increase in buying pressure at the triangle's tip. This move could push SHIB over the crucial resistance level of $0.000019, and the volume spike would be the driving force behind it.
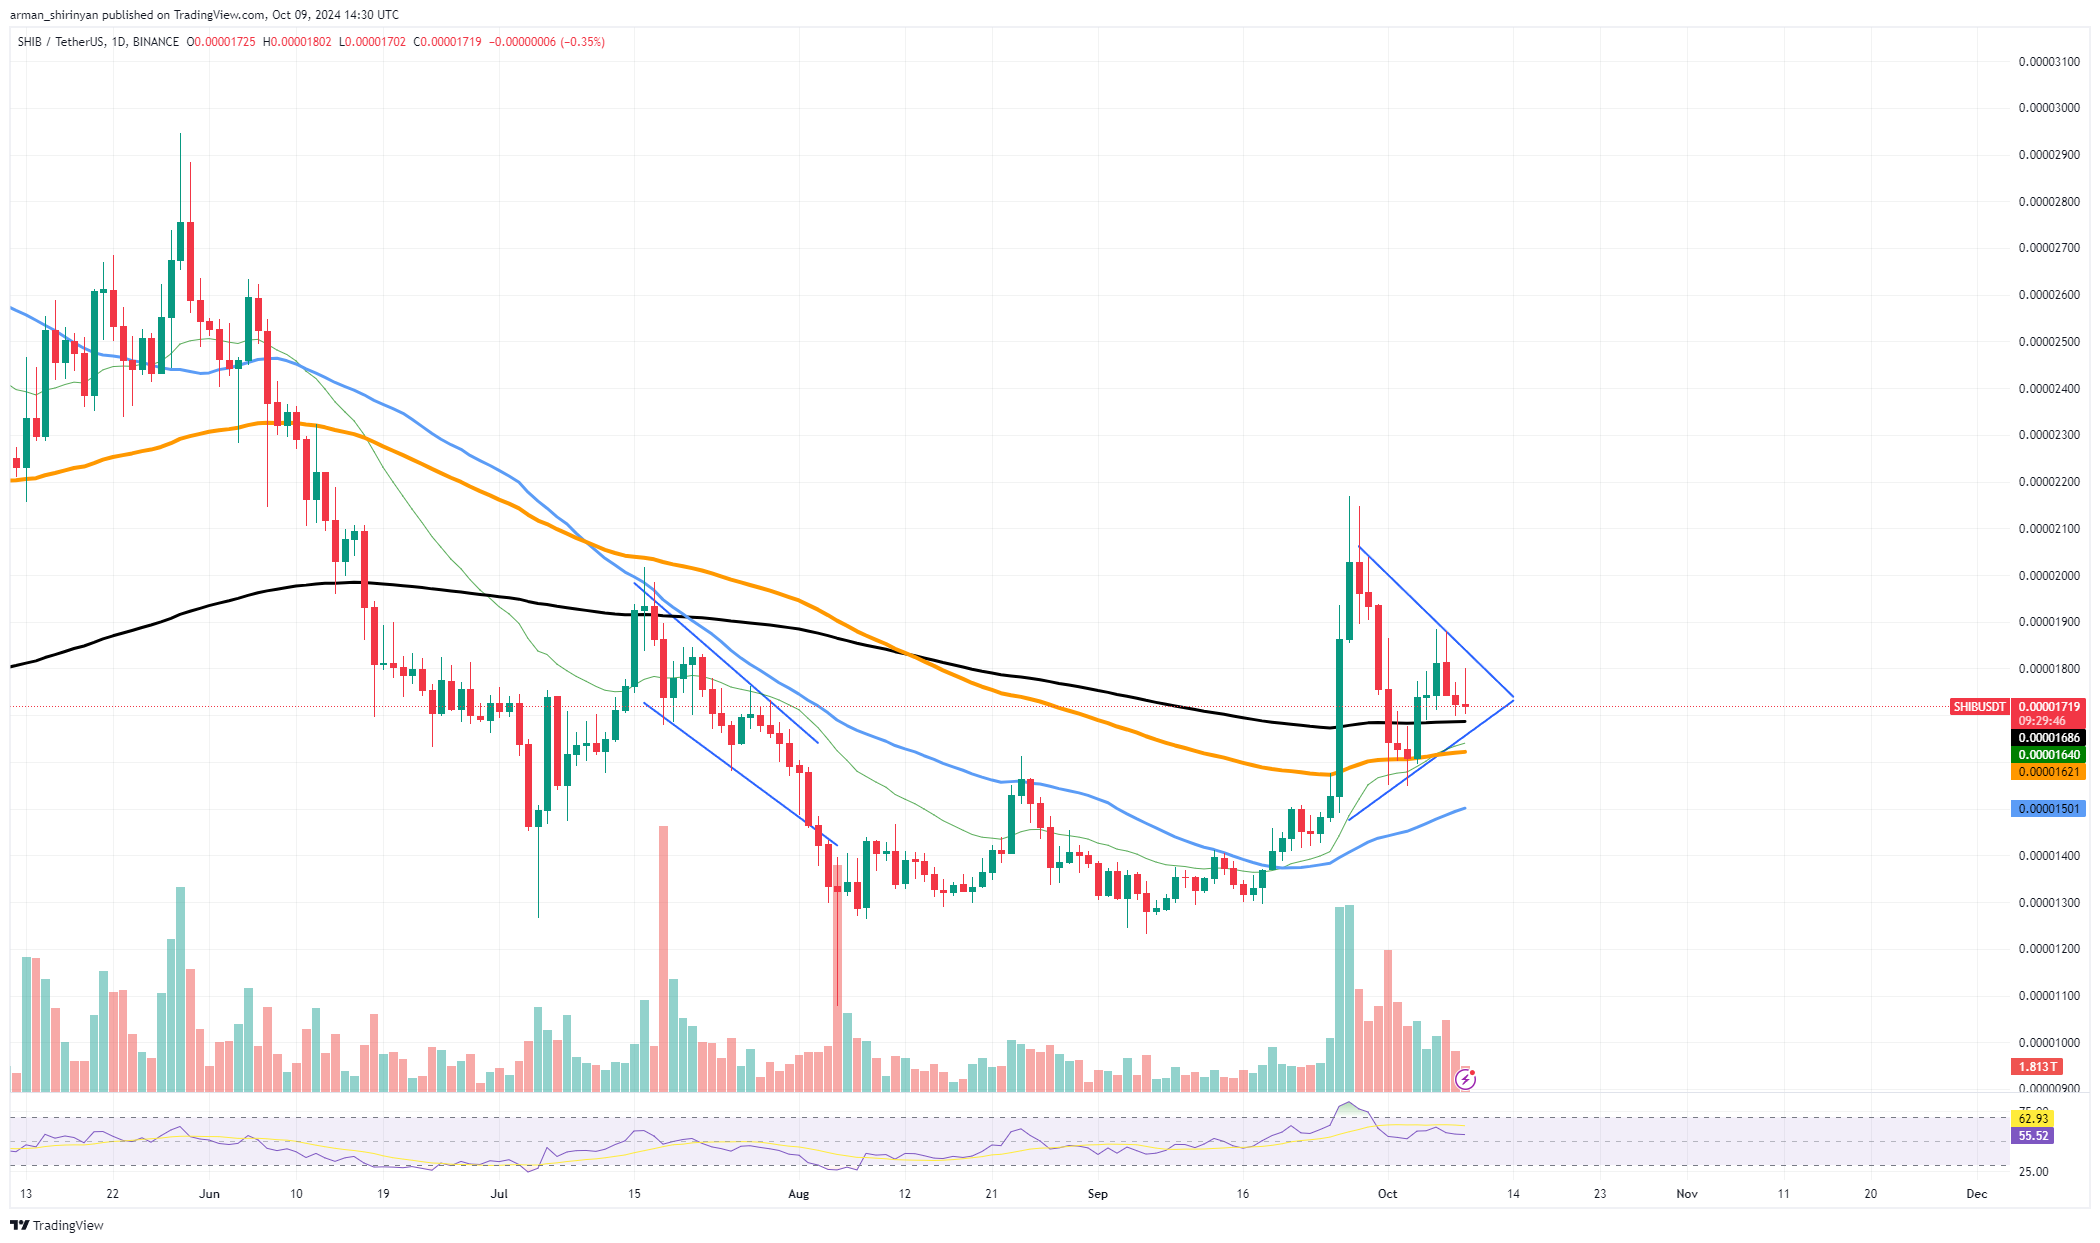 SHIB/USDT Chart by TradingView
This might position SHIB for a more robust rally, particularly if sentiment on the market as a whole improves. The next resistance levels, which are located between $0.000022 and $0.000025, could be the target for SHIB's retest if the bulls gain control, indicating substantial upside potential.
SHIB may break out of the triangle pattern and move lower if the volume spike indeed indicates selling pressure. Under these circumstances, the price may drop to retest lower support levels, which are approximately $0.000015 and $0.000013.
This would be a continuation of the downward trend that SHIB has been experiencing lately, and additional bearish momentum could be indicated if the downtrend fails to hold support at $0.000015.
XRP's sleep continues
Recently XRP has been experiencing poor price movement, circling $0.52 without much upward momentum. There are indications, though, that this slumping performance may be ending. A significant aspect to monitor is XRP's capacity to maintain stability in the vicinity of the $0.50 level, which is turning out to be a pivotal level.
A foundation for price recoveries has historically been established by keeping this support. A reversal may be in the offing as a result of the recent consolidation phase, which might indicate that sellers are losing ground. By continuing to remain above important moving averages like the 200-day EMA, the price has also demonstrated some resilience.
This signal implies that long-term investors might still be interested in XRP, and any increase from here might attract additional purchasers. The fact that volume has stabilized despite not being as high as desired suggests that traders are holding out for a big breakthrough. If the price breaks above the resistance level at $0.55, XRP may see a fresh uptick in buying interest.
Dogecoin is alive
Dogecoin continues to show resilience despite a recent price drop, maintaining its position within an uptrend. Important moving averages continue to support the price of DOGE, as can be seen on the chart maintaining the bullish trend for the time being.
The price drop that followed a test of resistance at the $0.12 mark has not entirely reversed the upward trend. Alternatively it might just be a brief retreat before DOGE picks up speed again. Approximately $0.10 is the critical support level to monitor. The probability of a reversal toward higher price targets will rise if DOGE is able to maintain this level and attract more buying pressure.
The next major resistance is located at $0.12. A break above this could spur a more robust rally and possibly drive DOGE back to the $0.14 level. Moreover, favorable advancements in the larger cryptocurrency market might give DOGE the impetus it needs, supporting the likelihood of a trend acceleration.
Traders should exercise caution, though, as a persistent decline below $0.10 would invalidate the bullish outlook and raise the possibility of additional downside risks. Dogecoin is still trending upward for the time being, but there is always a chance for an unexpected reversal.
免責聲明:投資有風險,本文並非投資建議,以上內容不應被視為任何金融產品的購買或出售要約、建議或邀請,作者或其他用戶的任何相關討論、評論或帖子也不應被視為此類內容。本文僅供一般參考,不考慮您的個人投資目標、財務狀況或需求。TTM對信息的準確性和完整性不承擔任何責任或保證,投資者應自行研究並在投資前尋求專業建議。
熱議股票
- 1
- 2
- 3
- 4
- 5
- 6
- 7
- 8
- 9
- 10