2 Reasons Why Dogwifhat (WIF) Return to $3 May Be Delayed
- WIF surged 42% last month but weakening momentum suggests a trend reversal is imminent.
- RSI decline from 74 to 45.34 signals reduced buying pressure, approaching neutral territory.
- ADX drop to 18.73 highlights weakening trend strength, indicating potential market volatility.
Dogwifhat (WIF) has surged 42% over the past 30 days, but sustaining this momentum and reaching $3 again remains uncertain.
The bullish trend appears to be weakening, as indicators like the Relative Strength Index (RSI) and Average Directional Index (ADX) show diminishing trend strength, signaling caution.
RSI Decline Signals Potential Reversal for WIF
WIF’s RSI is currently at 45.34, down from 74 on October 7. This decline suggests that buying momentum has weakened significantly, as fewer investors are entering the market at current levels.
RSI, or Relative Strength Index, measures the speed and change of price movements, providing insight into whether an asset is overbought or oversold. It ranges from 0 to 100, with values above 70 indicating overbought conditions, where a pullback might occur, and values below 30 indicating oversold conditions, which can signal a buying opportunity.
Read more: How To Buy Dogwifhat (WIF) and Everything Else To Know
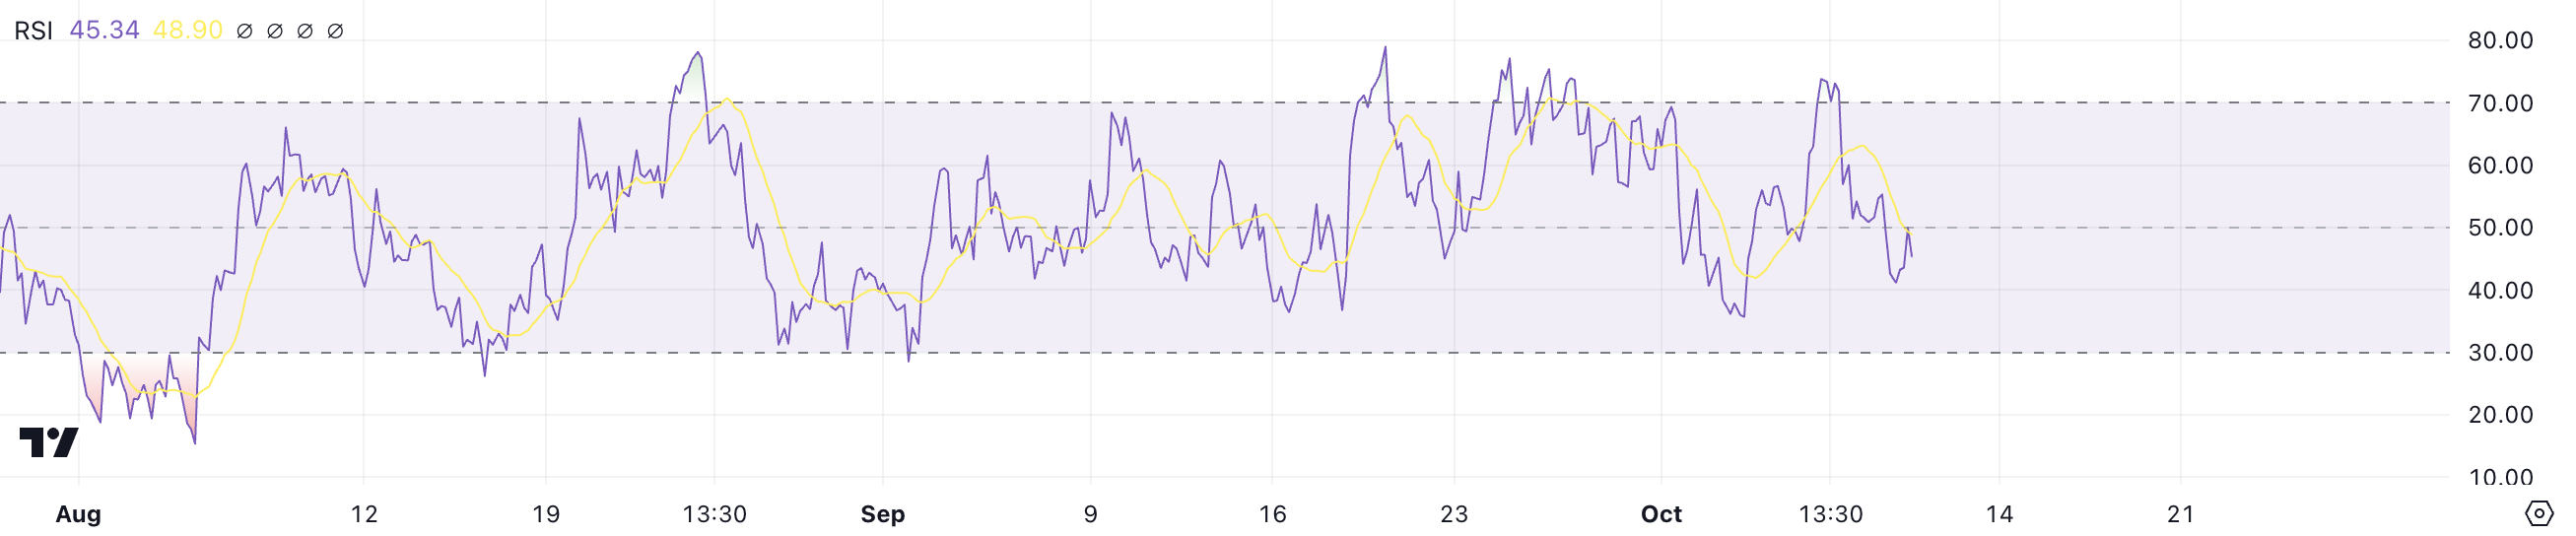
An RSI of 45.34 indicates that WIF is approaching neutral territory after previously being overbought. This level suggests that buying pressure is diminishing, and the market could be entering a consolidation phase.
Although the token remains in an uptrend, the recent drop in RSI could indicate a potential reversal if buying momentum doesn’t return. If this downward trend persists, WIF’s price could lose its upward momentum, resulting in increased selling pressure and a potential downturn. Traders should watch for further weakening signals to anticipate the next market move.
Dogwifhat Signals Weakening Trend for WIF
WIF’s ADX is currently at 18.73, down from 53 on October 1. This decline indicates that the strength of the current trend has weakened substantially, showing a loss of momentum in the recent uptrend.
ADX, or Average Directional Index, is used to quantify the strength of a trend, regardless of whether it is moving up or down. It ranges from 0 to 100, with values above 25 typically considered indicative of a strong trend, while values below 20 suggest a weak or non-existent trend.
The dramatic drop in ADX suggests that the previously strong uptrend in WIF is fading, and market participants are no longer showing strong conviction. This drop in trend strength can lead to uncertainty, as the market struggles to decide on a clear direction.
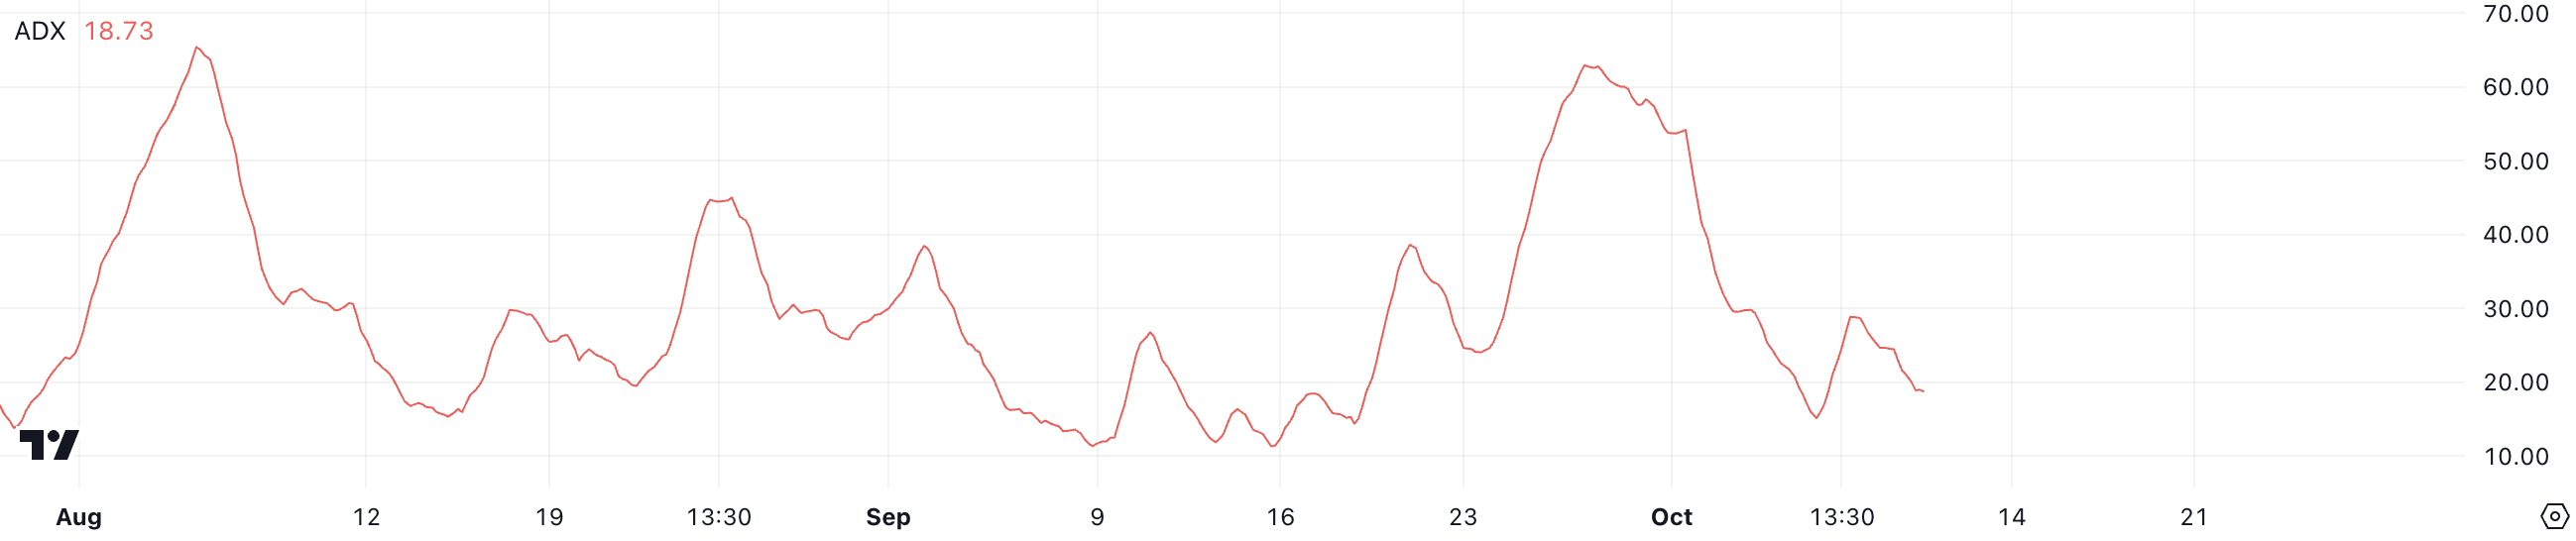
Although WIF is still technically in an uptrend, the current ADX level of around 18 indicates that this trend is not strong enough to sustain further growth without renewed buying interest. The low ADX value means that WIF’s price lacks a definitive direction and could be prone to significant volatility.
Traders should be cautious in such an environment, as the lack of strong momentum makes it difficult to predict whether the price will continue upward or reverse into a downtrend. Without a clear directional bias, WIF’s price movement may become erratic, and a potential reversal is possible if the current conditions persist.
WIF Price Prediction: Bullish Run Faces Potential Correction
WIF has surged 42% over the past month, emerging as the top performer among the leading five meme coins. It has now become the largest meme coin on the Solana network. WIF’s market capitalization is more than 60% larger than that of its closest competitor, BONK.
After such a significant surge, it’s natural that a correction could occur as traders take profits and buying momentum slows. Currently, WIF’s EMA lines are still showing a bullish pattern, with short-term EMAs positioned above the long-term ones. However, the short-term lines have started to move downward since yesterday, which could indicate a potential reversal.
EMA lines, or Exponential Moving Averages, are a type of moving average that gives more weight to recent price data, making them more responsive to short-term movements. They are often used to identify trends and potential reversals in price action.
Read more: How to Buy Solana Meme Coins: A Step-By-Step Guide
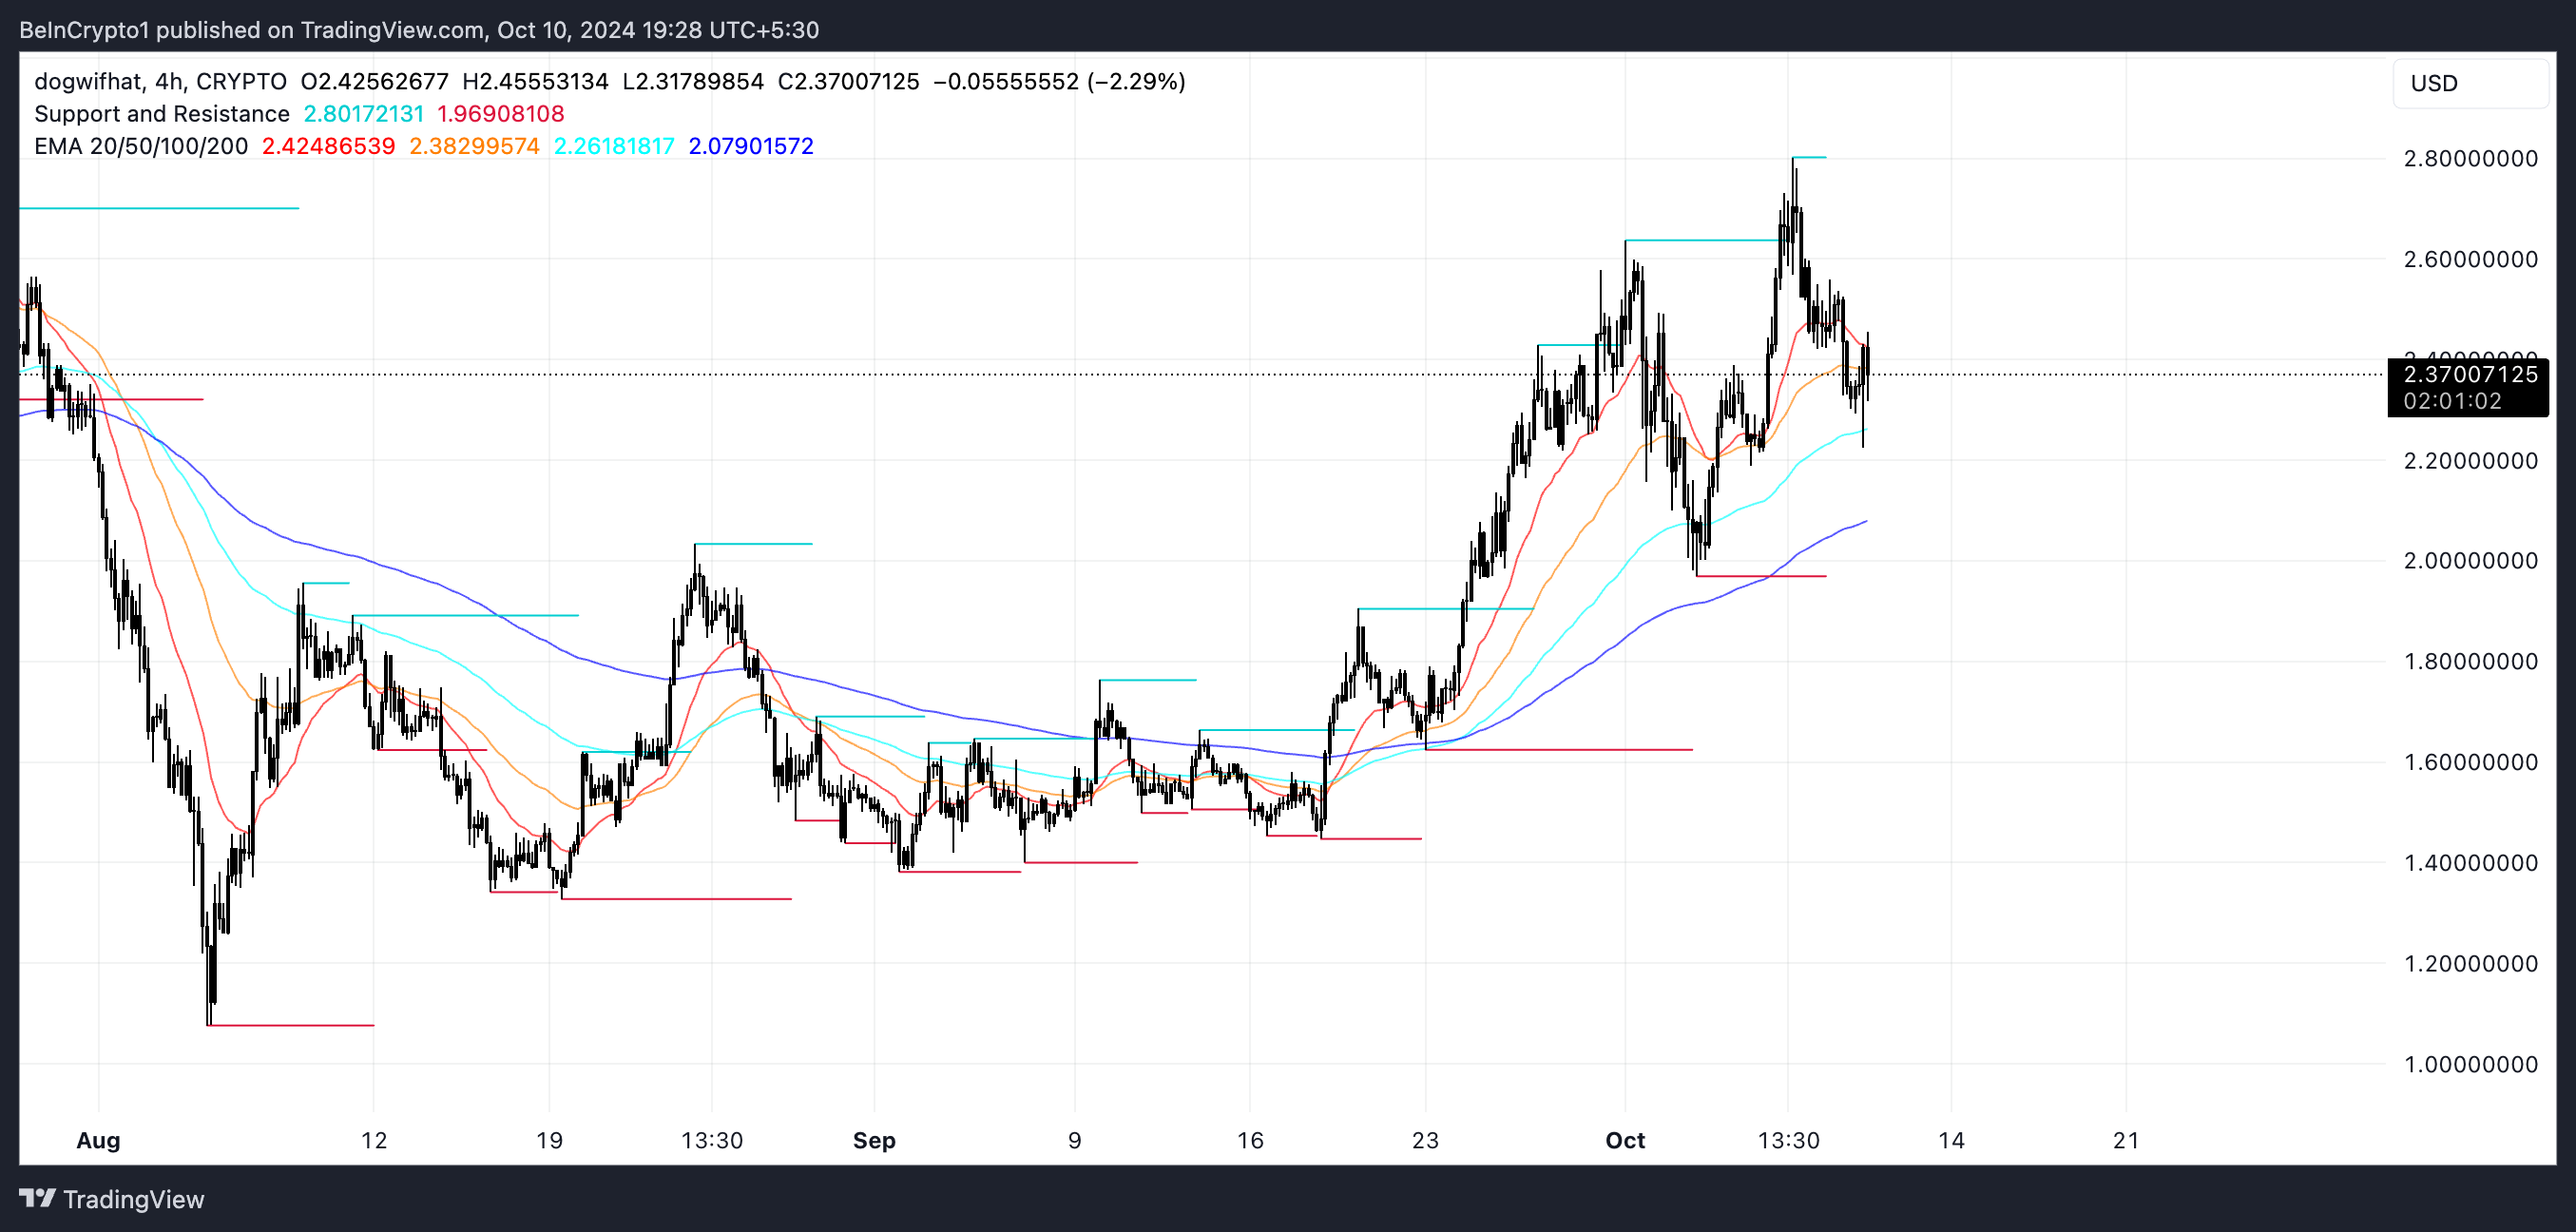
If a reversal occurs, WIF’s price could soon test the support level at $1.62. This would mark a key point where traders will watch to see if the trend continues downward or stabilizes. However, if the uptrend regains strength, WIF should test resistance levels around $2.63 and $2.8.
A breakout above these resistance levels could spark a new rally, potentially pushing WIF back to the $3 zone — a price it hasn’t reached since June 2024. The market’s reaction at these key levels will determine whether WIF continues its bullish momentum or enters a corrective phase.
免責聲明:投資有風險,本文並非投資建議,以上內容不應被視為任何金融產品的購買或出售要約、建議或邀請,作者或其他用戶的任何相關討論、評論或帖子也不應被視為此類內容。本文僅供一般參考,不考慮您的個人投資目標、財務狀況或需求。TTM對信息的準確性和完整性不承擔任何責任或保證,投資者應自行研究並在投資前尋求專業建議。
熱議股票
- 1
- 2
- 3
- 4
- 5
- 6
- 7
- 8
- 9
- 10