Shiba Inu Price Tumbles 18% Amidst Crypto Market Downturn
- Shiba Inu’s price has plummeted by 18%, indicating a downtrend fueled by weak market sentiment.
- Falling open interest and declining Mean Dollar Invested Age (MDIA) reflect increased selling pressure.
- If SHIB fails to hold the 20-day EMA at $0.000020, it could drop to $0.000016; otherwise, support could spark a recovery.
Leading meme coin Shiba Inu (SHIB) has seen an 18% price drop in the past 24 hours. This mirrors the broader cryptocurrency market’s downturn, with global market capitalization falling by 5% over the same period.
An assessment of the meme coin’s on-chain and technical setup has revealed a weakening bullish momentum and a growing dominance of bearish sentiment. This indicates that SHIB may extend this downtrend. Here is how.
Shiba Inu Loses Its Bulls
Shiba Inu’s declining open interest (OI) confirms the decrease in market activity and a waning of bullish enthusiasm among the meme coin holders. As of this writing, this stands at $82.49 million, noting a 32% fall over the past 24 hours.
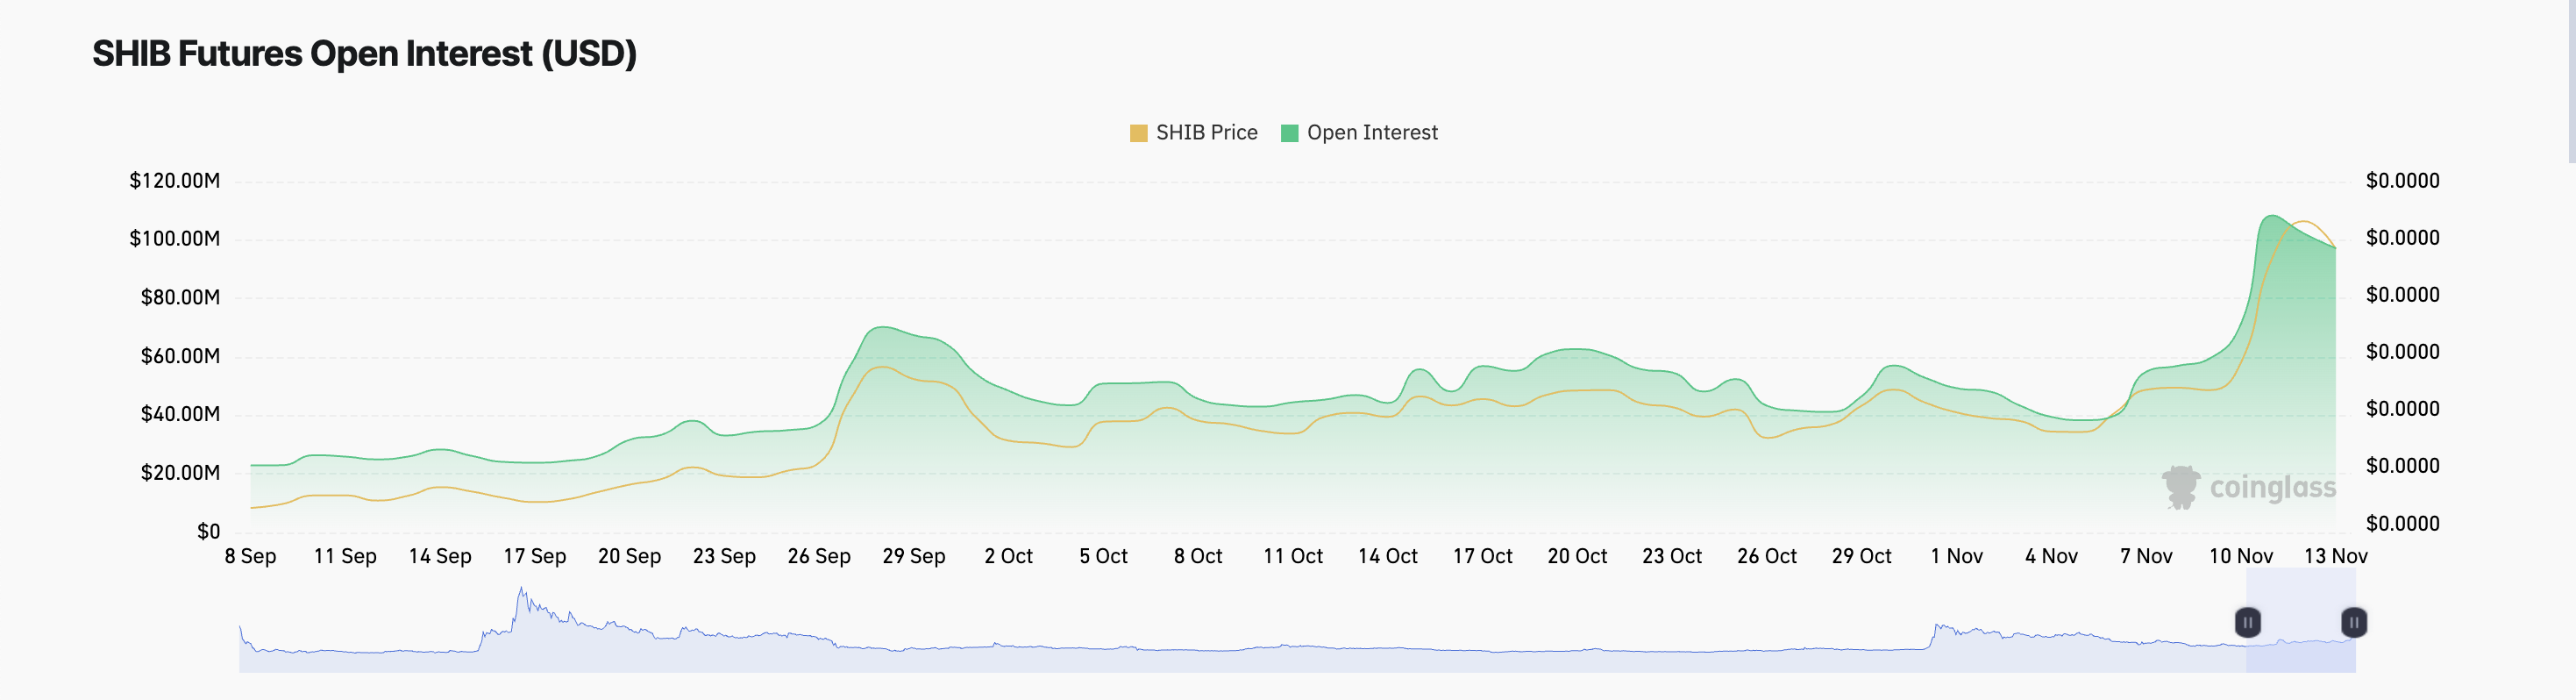
OI refers to the total number of active contracts in the futures or options market that have not yet been settled, expired, or closed out. When it falls, it is a bearish signal. It suggests that traders are closing out their positions, likely because they believe the asset’s value will continue to drop or because they want to limit losses.
This drop in OI amid falling prices, as in SHIB’s case, is a sign that bearish sentiment is strong among market participants.
Additionally, the meme coin’s Mean Dollar Invested Age (MDIA) has declined steadily since November 9, confirming the uptick in selling pressure in the market. As of this writing, SHIB’s MDIA is 877, having decreased by 1.5% over the past four days.
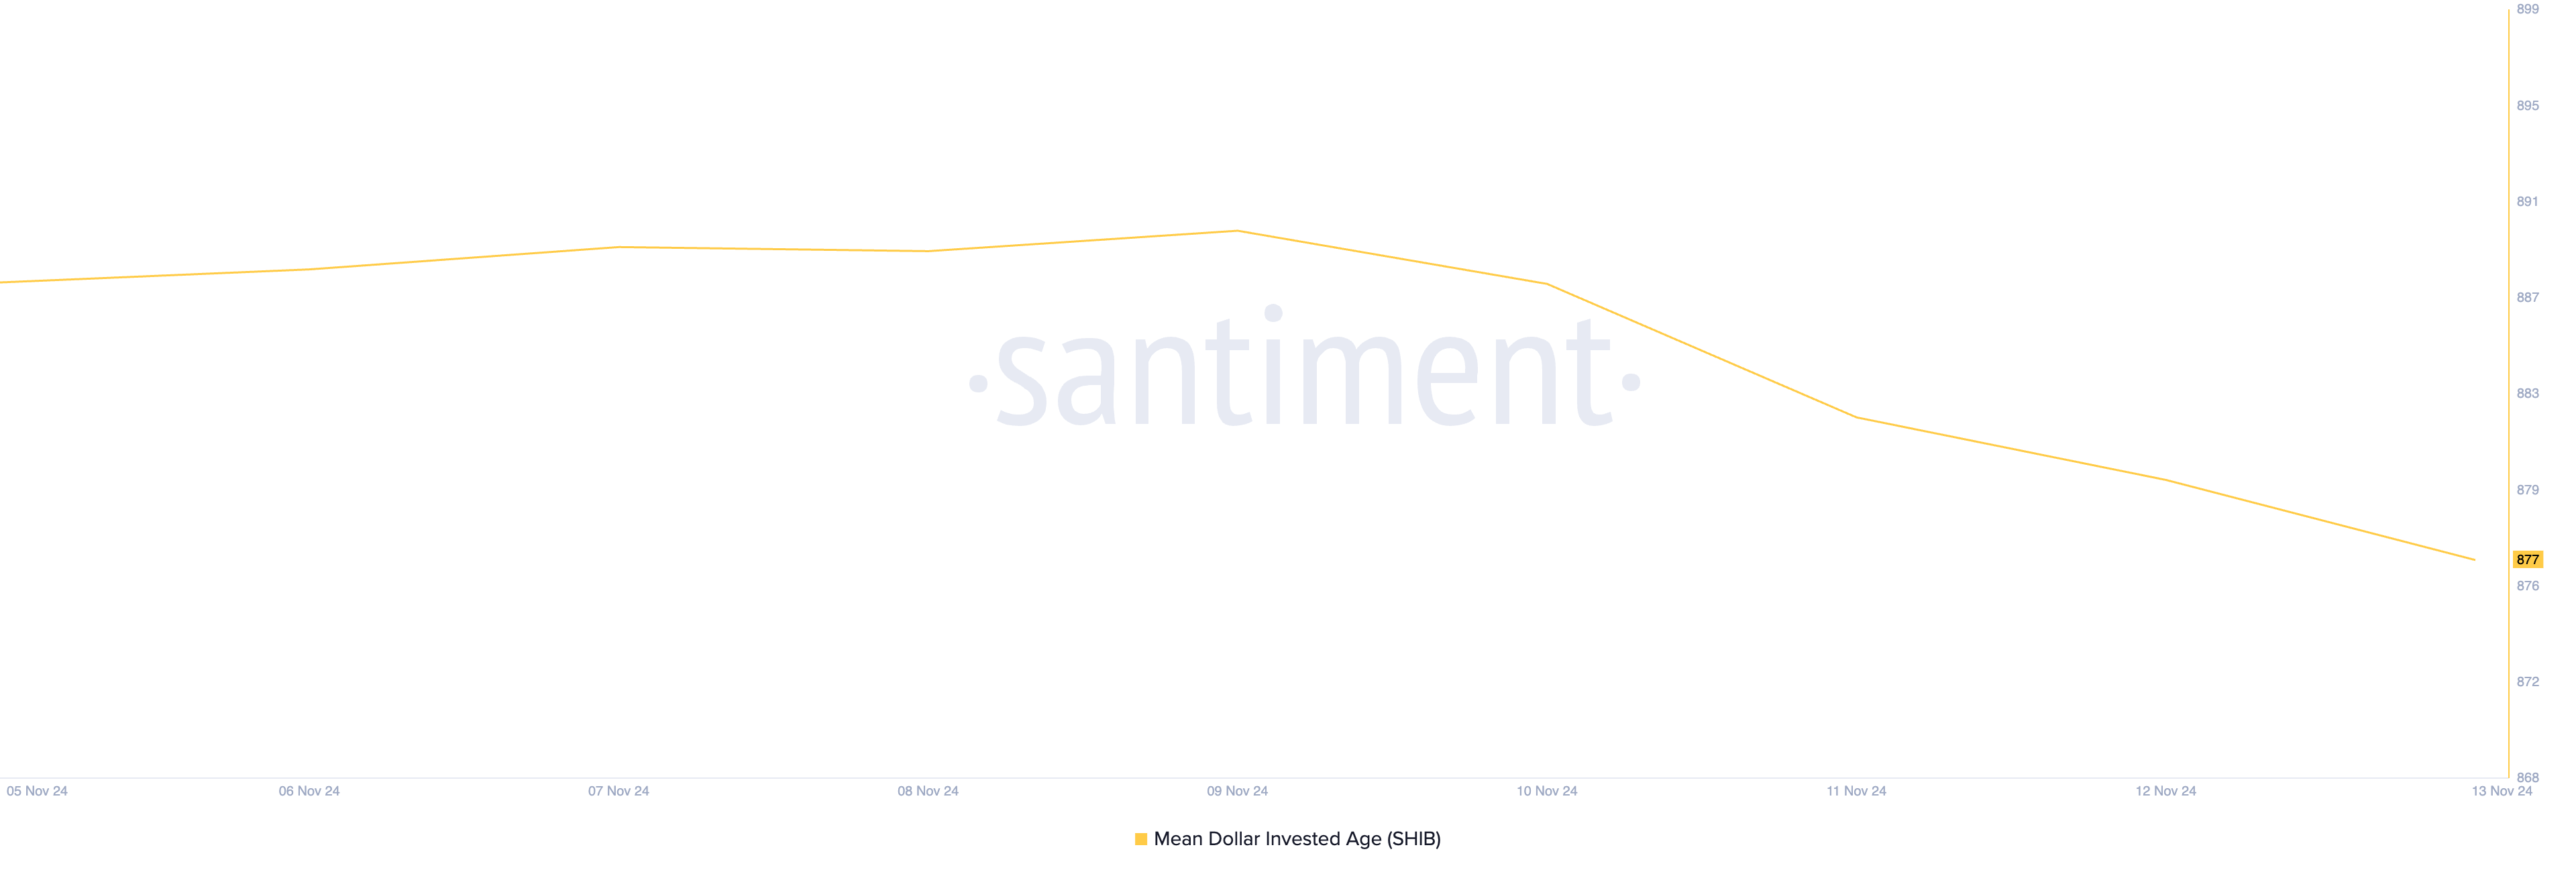
The MDIA tracks the average age of coins based on their dollar value. It measures how long, on average, a dollar invested in a cryptocurrency has remained idle in its current wallet address. A higher MDIA suggests that investors have kept their holdings over extended periods, while a lower MDIA means recent capital inflows or outflows.
When an asset’s MDIA falls, it suggests that older coins are being moved, indicating increased trading activity. When this happens during a period of price decline, it indicates profit-taking or loss-cutting.
It suggests a shift in market sentiment, with investors showing a greater willingness to sell their holdings. This selling activity contributes to a bearish trend as selling pressure outweighs buying pressure.
SHIB Price Prediction: Key Targets To Watch
As of this writing, Shiba Inu trades at $0.000023. Its double-digit fall over the past 24 hours has caused its price to decline toward its 20-day exponential moving average (EMA), which tracks its average price over the past 20 trading days.
The 20-day EMA acts as a dynamic support level in an upward trend. A decline towards this level means a drop in buying pressure.
However, it offers a support floor where price corrections or pullbacks often find buying interest. For Shiba Inu, its 20-day EMA forms support at $0.000020.
If the price breaks below the 20-day EMA, it indicates a shift in momentum, as the meme coin is no longer finding support at this level. This breakdown will attract further selling, as traders view it as a bearish sign, prompting them to exit or take short positions. Should the $0.000020 price level fail to hold as support, the SHIB price drop will continue to $0.000016.
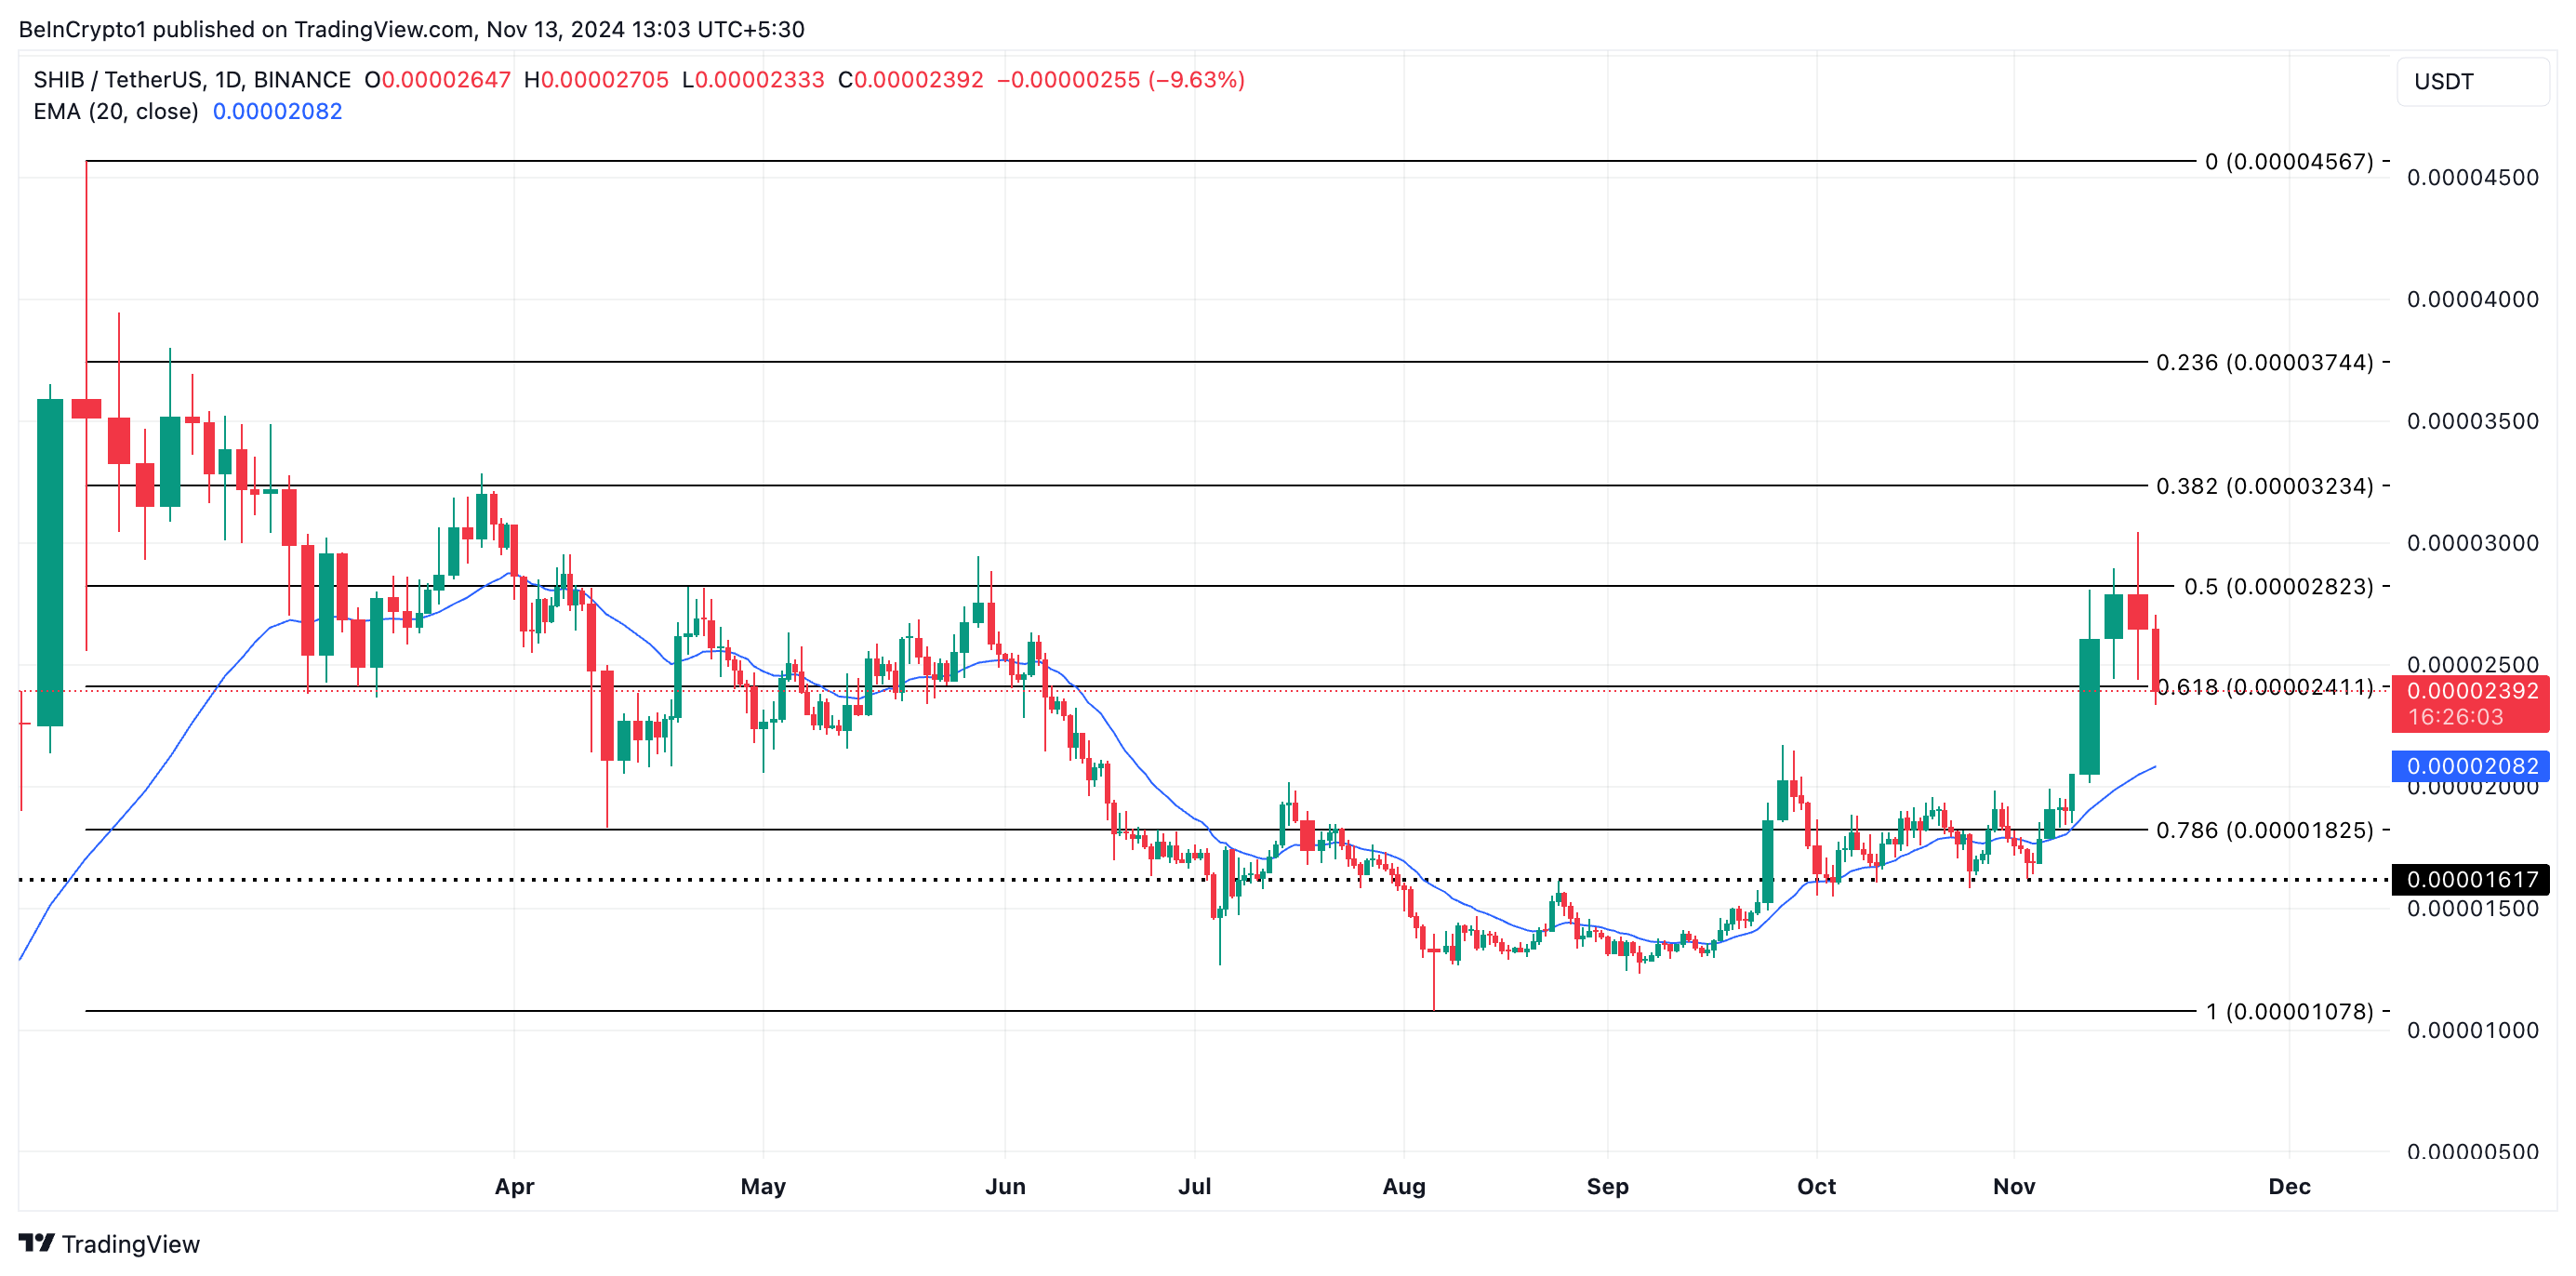
However, if the 20-day EMA provides support, SHIB’s price may resume its uptrend and attempt to reclaim $0.000028.
免責聲明:投資有風險,本文並非投資建議,以上內容不應被視為任何金融產品的購買或出售要約、建議或邀請,作者或其他用戶的任何相關討論、評論或帖子也不應被視為此類內容。本文僅供一般參考,不考慮您的個人投資目標、財務狀況或需求。TTM對信息的準確性和完整性不承擔任何責任或保證,投資者應自行研究並在投資前尋求專業建議。
熱議股票
- 1
- 2
- 3
- 4
- 5
- 6
- 7
- 8
- 9
- 10