Is ArcBest Corporation's (NASDAQ:ARCB) Stock's Recent Performance Being Led By Its Attractive Financial Prospects?
Most readers would already be aware that ArcBest's (NASDAQ:ARCB) stock increased significantly by 8.9% over the past month. Given that the market rewards strong financials in the long-term, we wonder if that is the case in this instance. In this article, we decided to focus on ArcBest's ROE.
ROE or return on equity is a useful tool to assess how effectively a company can generate returns on the investment it received from its shareholders. Put another way, it reveals the company's success at turning shareholder investments into profits.
See our latest analysis for ArcBest
How Is ROE Calculated?
The formula for return on equity is:
Return on Equity = Net Profit (from continuing operations) ÷ Shareholders' Equity
So, based on the above formula, the ROE for ArcBest is:
15% = US$193m ÷ US$1.3b (Based on the trailing twelve months to September 2024).
The 'return' refers to a company's earnings over the last year. One way to conceptualize this is that for each $1 of shareholders' capital it has, the company made $0.15 in profit.
What Is The Relationship Between ROE And Earnings Growth?
Thus far, we have learned that ROE measures how efficiently a company is generating its profits. Depending on how much of these profits the company reinvests or "retains", and how effectively it does so, we are then able to assess a company’s earnings growth potential. Assuming all else is equal, companies that have both a higher return on equity and higher profit retention are usually the ones that have a higher growth rate when compared to companies that don't have the same features.
ArcBest's Earnings Growth And 15% ROE
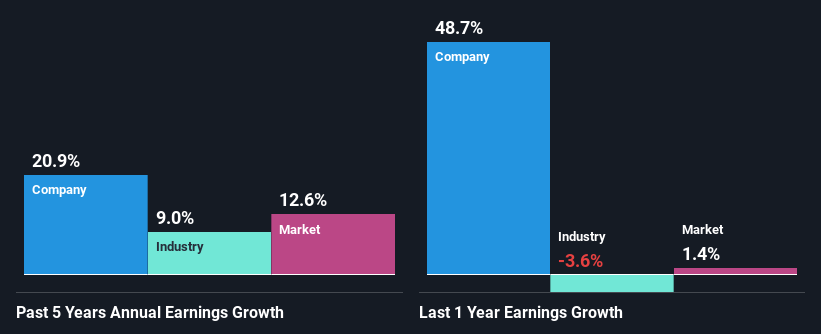
To start with, ArcBest's ROE looks acceptable. And on comparing with the industry, we found that the the average industry ROE is similar at 15%. This certainly adds some context to ArcBest's exceptional 21% net income growth seen over the past five years. We believe that there might also be other aspects that are positively influencing the company's earnings growth. For example, it is possible that the company's management has made some good strategic decisions, or that the company has a low payout ratio.
Next, on comparing with the industry net income growth, we found that ArcBest's growth is quite high when compared to the industry average growth of 9.0% in the same period, which is great to see.
Earnings growth is a huge factor in stock valuation. What investors need to determine next is if the expected earnings growth, or the lack of it, is already built into the share price. This then helps them determine if the stock is placed for a bright or bleak future. What is ARCB worth today? The intrinsic value infographic in our free research report helps visualize whether ARCB is currently mispriced by the market.
Is ArcBest Using Its Retained Earnings Effectively?
ArcBest's three-year median payout ratio to shareholders is 4.8%, which is quite low. This implies that the company is retaining 95% of its profits. So it looks like ArcBest is reinvesting profits heavily to grow its business, which shows in its earnings growth.
Moreover, ArcBest is determined to keep sharing its profits with shareholders which we infer from its long history of paying a dividend for at least ten years. Based on the latest analysts' estimates, we found that the company's future payout ratio over the next three years is expected to hold steady at 4.8%. Accordingly, forecasts suggest that ArcBest's future ROE will be 16% which is again, similar to the current ROE.
Summary
In total, we are pretty happy with ArcBest's performance. Specifically, we like that the company is reinvesting a huge chunk of its profits at a high rate of return. This of course has caused the company to see substantial growth in its earnings. With that said, the latest industry analyst forecasts reveal that the company's earnings growth is expected to slow down. To know more about the latest analysts predictions for the company, check out this visualization of analyst forecasts for the company.
New: Manage All Your Stock Portfolios in One Place
We've created the ultimate portfolio companion for stock investors, and it's free.
• Connect an unlimited number of Portfolios and see your total in one currency• Be alerted to new Warning Signs or Risks via email or mobile• Track the Fair Value of your stocks
Try a Demo Portfolio for FreeHave feedback on this article? Concerned about the content? Get in touch with us directly. Alternatively, email editorial-team (at) simplywallst.com.This article by Simply Wall St is general in nature. We provide commentary based on historical data and analyst forecasts only using an unbiased methodology and our articles are not intended to be financial advice. It does not constitute a recommendation to buy or sell any stock, and does not take account of your objectives, or your financial situation. We aim to bring you long-term focused analysis driven by fundamental data. Note that our analysis may not factor in the latest price-sensitive company announcements or qualitative material. Simply Wall St has no position in any stocks mentioned.
免責聲明:投資有風險,本文並非投資建議,以上內容不應被視為任何金融產品的購買或出售要約、建議或邀請,作者或其他用戶的任何相關討論、評論或帖子也不應被視為此類內容。本文僅供一般參考,不考慮您的個人投資目標、財務狀況或需求。TTM對信息的準確性和完整性不承擔任何責任或保證,投資者應自行研究並在投資前尋求專業建議。
熱議股票
- 1
- 2
- 3
- 4
- 5
- 6
- 7
- 8
- 9
- 10