Why We're Not Concerned About Olin Corporation's (NYSE:OLN) Share Price
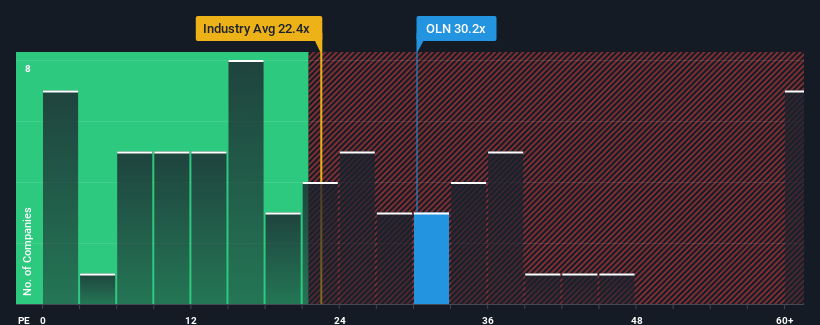
With a price-to-earnings (or "P/E") ratio of 30.2x Olin Corporation (NYSE:OLN) may be sending very bearish signals at the moment, given that almost half of all companies in the United States have P/E ratios under 19x and even P/E's lower than 11x are not unusual. Nonetheless, we'd need to dig a little deeper to determine if there is a rational basis for the highly elevated P/E.
While the market has experienced earnings growth lately, Olin's earnings have gone into reverse gear, which is not great. It might be that many expect the dour earnings performance to recover substantially, which has kept the P/E from collapsing. If not, then existing shareholders may be extremely nervous about the viability of the share price.
See our latest analysis for Olin
Is There Enough Growth For Olin?
In order to justify its P/E ratio, Olin would need to produce outstanding growth well in excess of the market.
Taking a look back first, the company's earnings per share growth last year wasn't something to get excited about as it posted a disappointing decline of 73%. This means it has also seen a slide in earnings over the longer-term as EPS is down 79% in total over the last three years. Accordingly, shareholders would have felt downbeat about the medium-term rates of earnings growth.
Turning to the outlook, the next year should generate growth of 114% as estimated by the analysts watching the company. That's shaping up to be materially higher than the 15% growth forecast for the broader market.
With this information, we can see why Olin is trading at such a high P/E compared to the market. It seems most investors are expecting this strong future growth and are willing to pay more for the stock.
What We Can Learn From Olin's P/E?
We'd say the price-to-earnings ratio's power isn't primarily as a valuation instrument but rather to gauge current investor sentiment and future expectations.
We've established that Olin maintains its high P/E on the strength of its forecast growth being higher than the wider market, as expected. Right now shareholders are comfortable with the P/E as they are quite confident future earnings aren't under threat. Unless these conditions change, they will continue to provide strong support to the share price.
You should always think about risks. Case in point, we've spotted 2 warning signs for Olin you should be aware of, and 1 of them is a bit concerning.
Of course, you might also be able to find a better stock than Olin. So you may wish to see this free collection of other companies that have reasonable P/E ratios and have grown earnings strongly.
New: AI Stock Screener & Alerts
Our new AI Stock Screener scans the market every day to uncover opportunities.
• Dividend Powerhouses (3%+ Yield)• Undervalued Small Caps with Insider Buying• High growth Tech and AI CompaniesOr build your own from over 50 metrics.
Explore Now for FreeHave feedback on this article? Concerned about the content? Get in touch with us directly. Alternatively, email editorial-team (at) simplywallst.com.This article by Simply Wall St is general in nature. We provide commentary based on historical data and analyst forecasts only using an unbiased methodology and our articles are not intended to be financial advice. It does not constitute a recommendation to buy or sell any stock, and does not take account of your objectives, or your financial situation. We aim to bring you long-term focused analysis driven by fundamental data. Note that our analysis may not factor in the latest price-sensitive company announcements or qualitative material. Simply Wall St has no position in any stocks mentioned.
免責聲明:投資有風險,本文並非投資建議,以上內容不應被視為任何金融產品的購買或出售要約、建議或邀請,作者或其他用戶的任何相關討論、評論或帖子也不應被視為此類內容。本文僅供一般參考,不考慮您的個人投資目標、財務狀況或需求。TTM對信息的準確性和完整性不承擔任何責任或保證,投資者應自行研究並在投資前尋求專業建議。
熱議股票
- 1
- 2
- 3
- 4
- 5
- 6
- 7
- 8
- 9
- 10