Bitget’s BGB Sees 24% Leap, Climbs to New All-Time High
- Bitget’s BGB reached a new all-time high of $3.15, with a minor 3% pullback to $3.10. It is still poised for further gains.
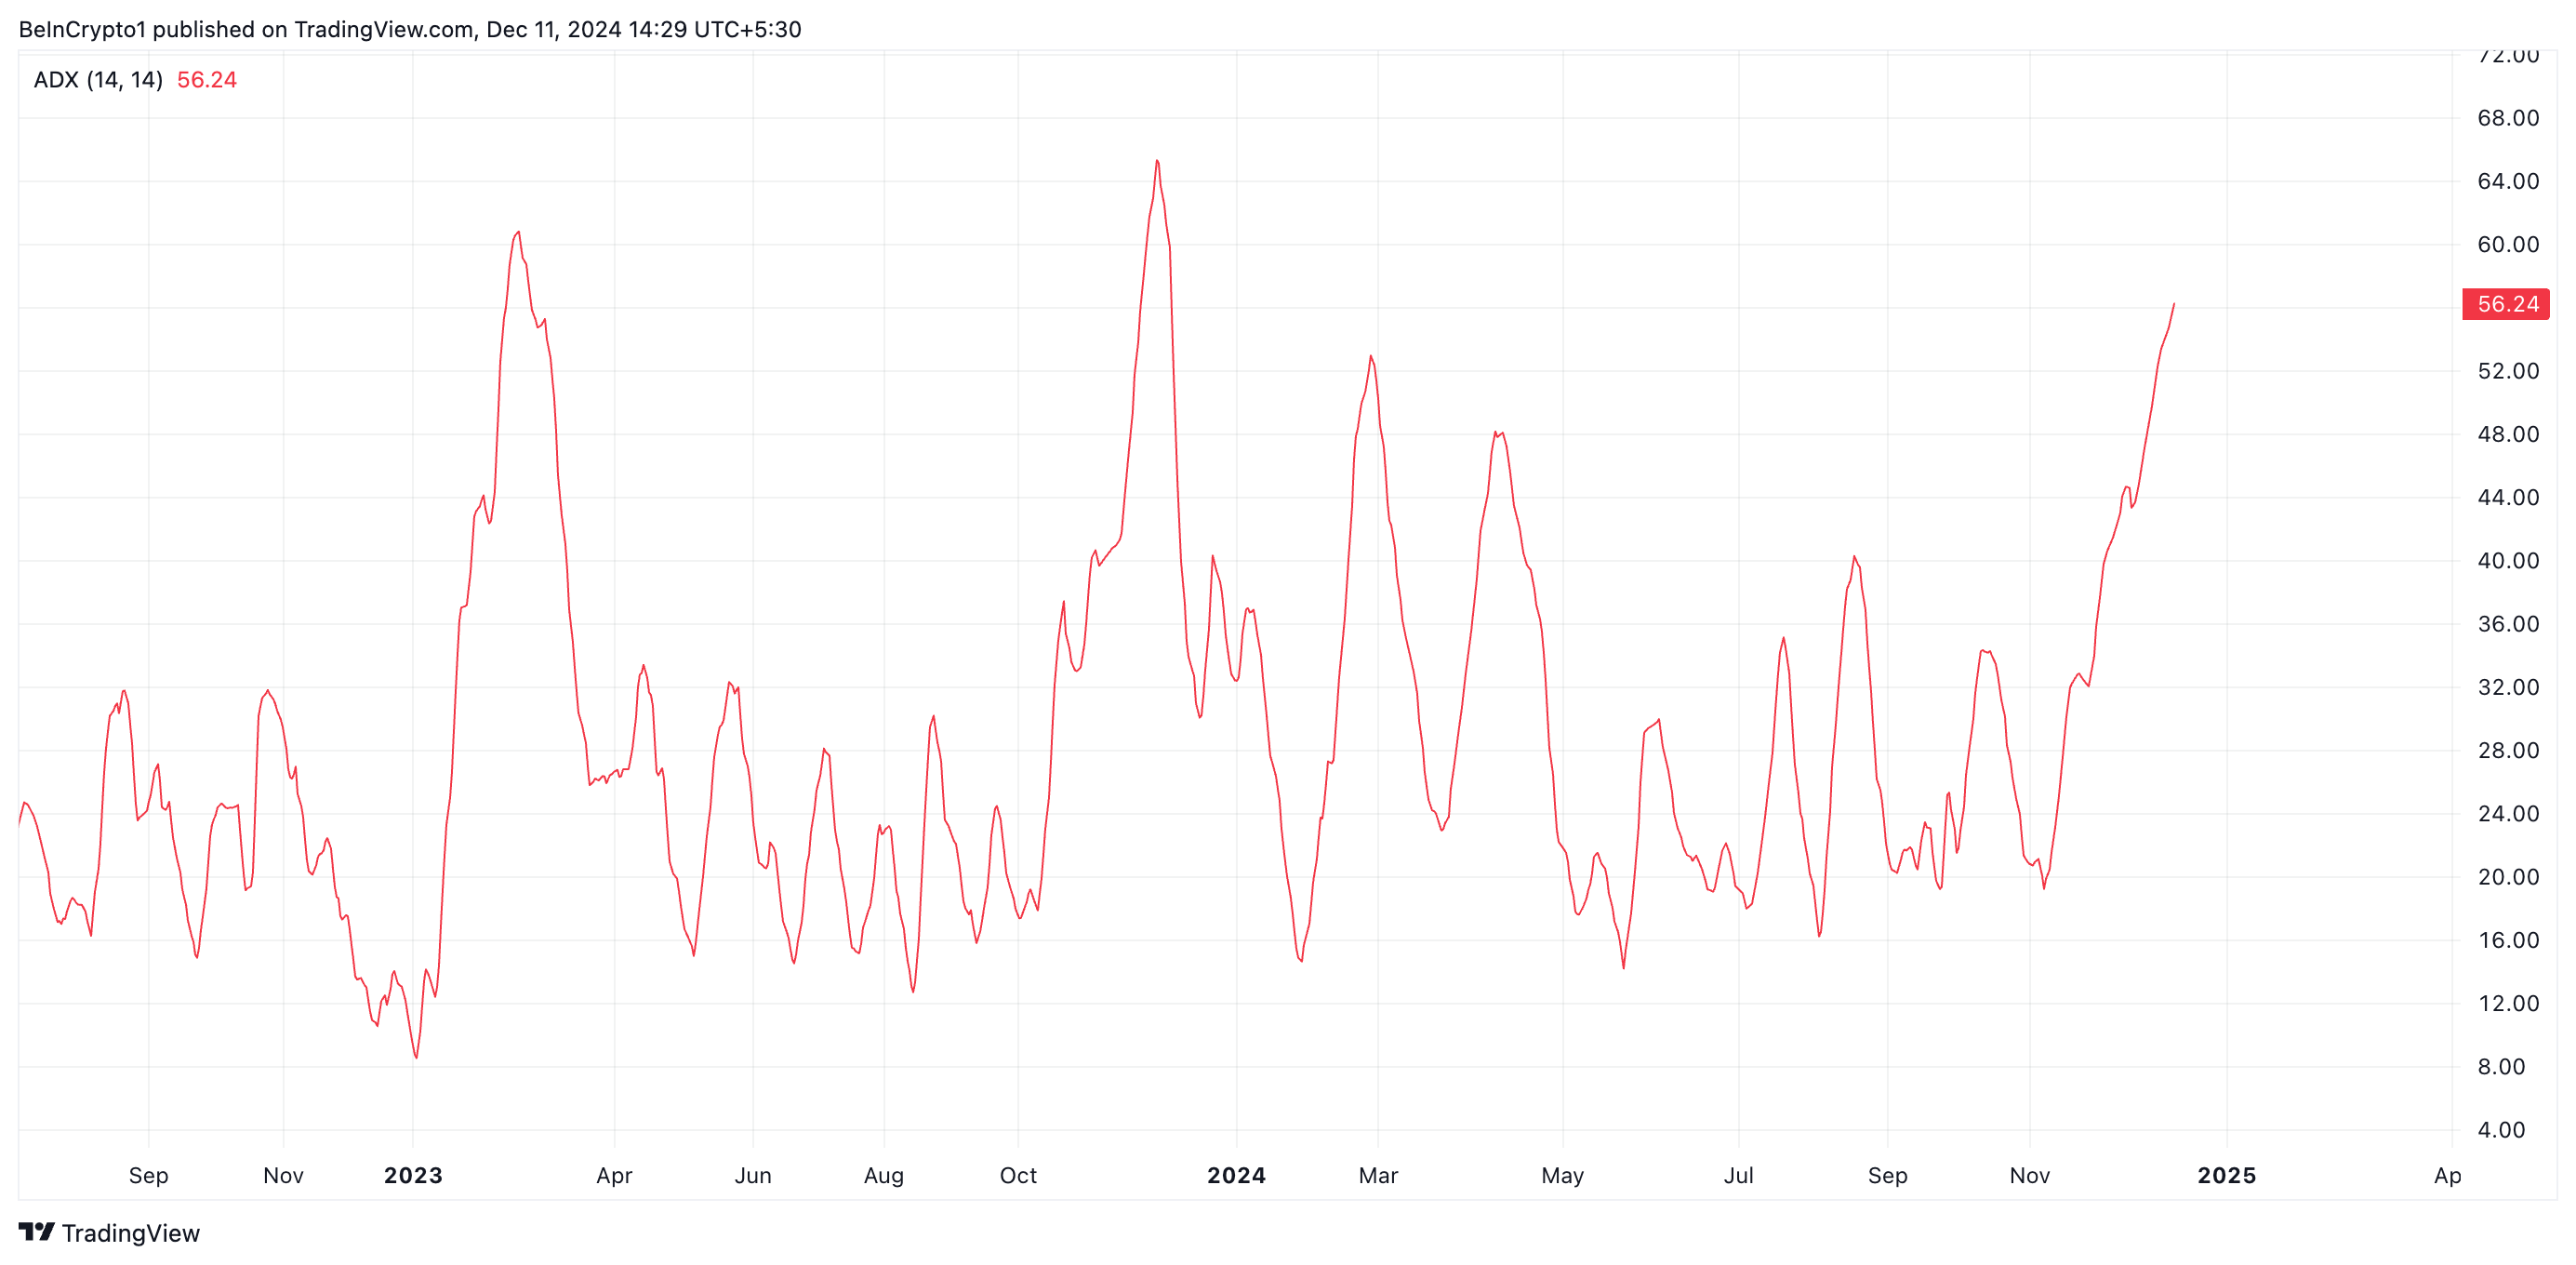
- The Average Directional Index (ADX) at 56.24 indicates strong bullish momentum, signaling potential for continued growth.
- BGB’s positive Chaikin Money Flow (CMF) at 0.28 shows strong buying pressure, supporting a potential rally past its all-time high.
Bitget’s BGB token has continued its bullish momentum, reaching a new all-time high of $3.15 during Wednesday’s early Asian session. However, it has since experienced a 3% pullback, trading at $3.10 at the time of writing.
Despite this slight retracement, BGB remains poised to reclaim and rally past this all-time high. This analysis explains why.
Bitget’s Uptrend Is Strong
BGB’s Average Directional Index (ADX) confirms that its current rally is strong and may continue in the mean term. As of this writing, it is at 56.24 and in an upward trend.
This indicator measures the strength of a trend, whether upward or downward, on a scale from 0 to 100. An ADX reading of 56.24 indicates a very strong trend, as values above 50 suggest strong momentum in the market.
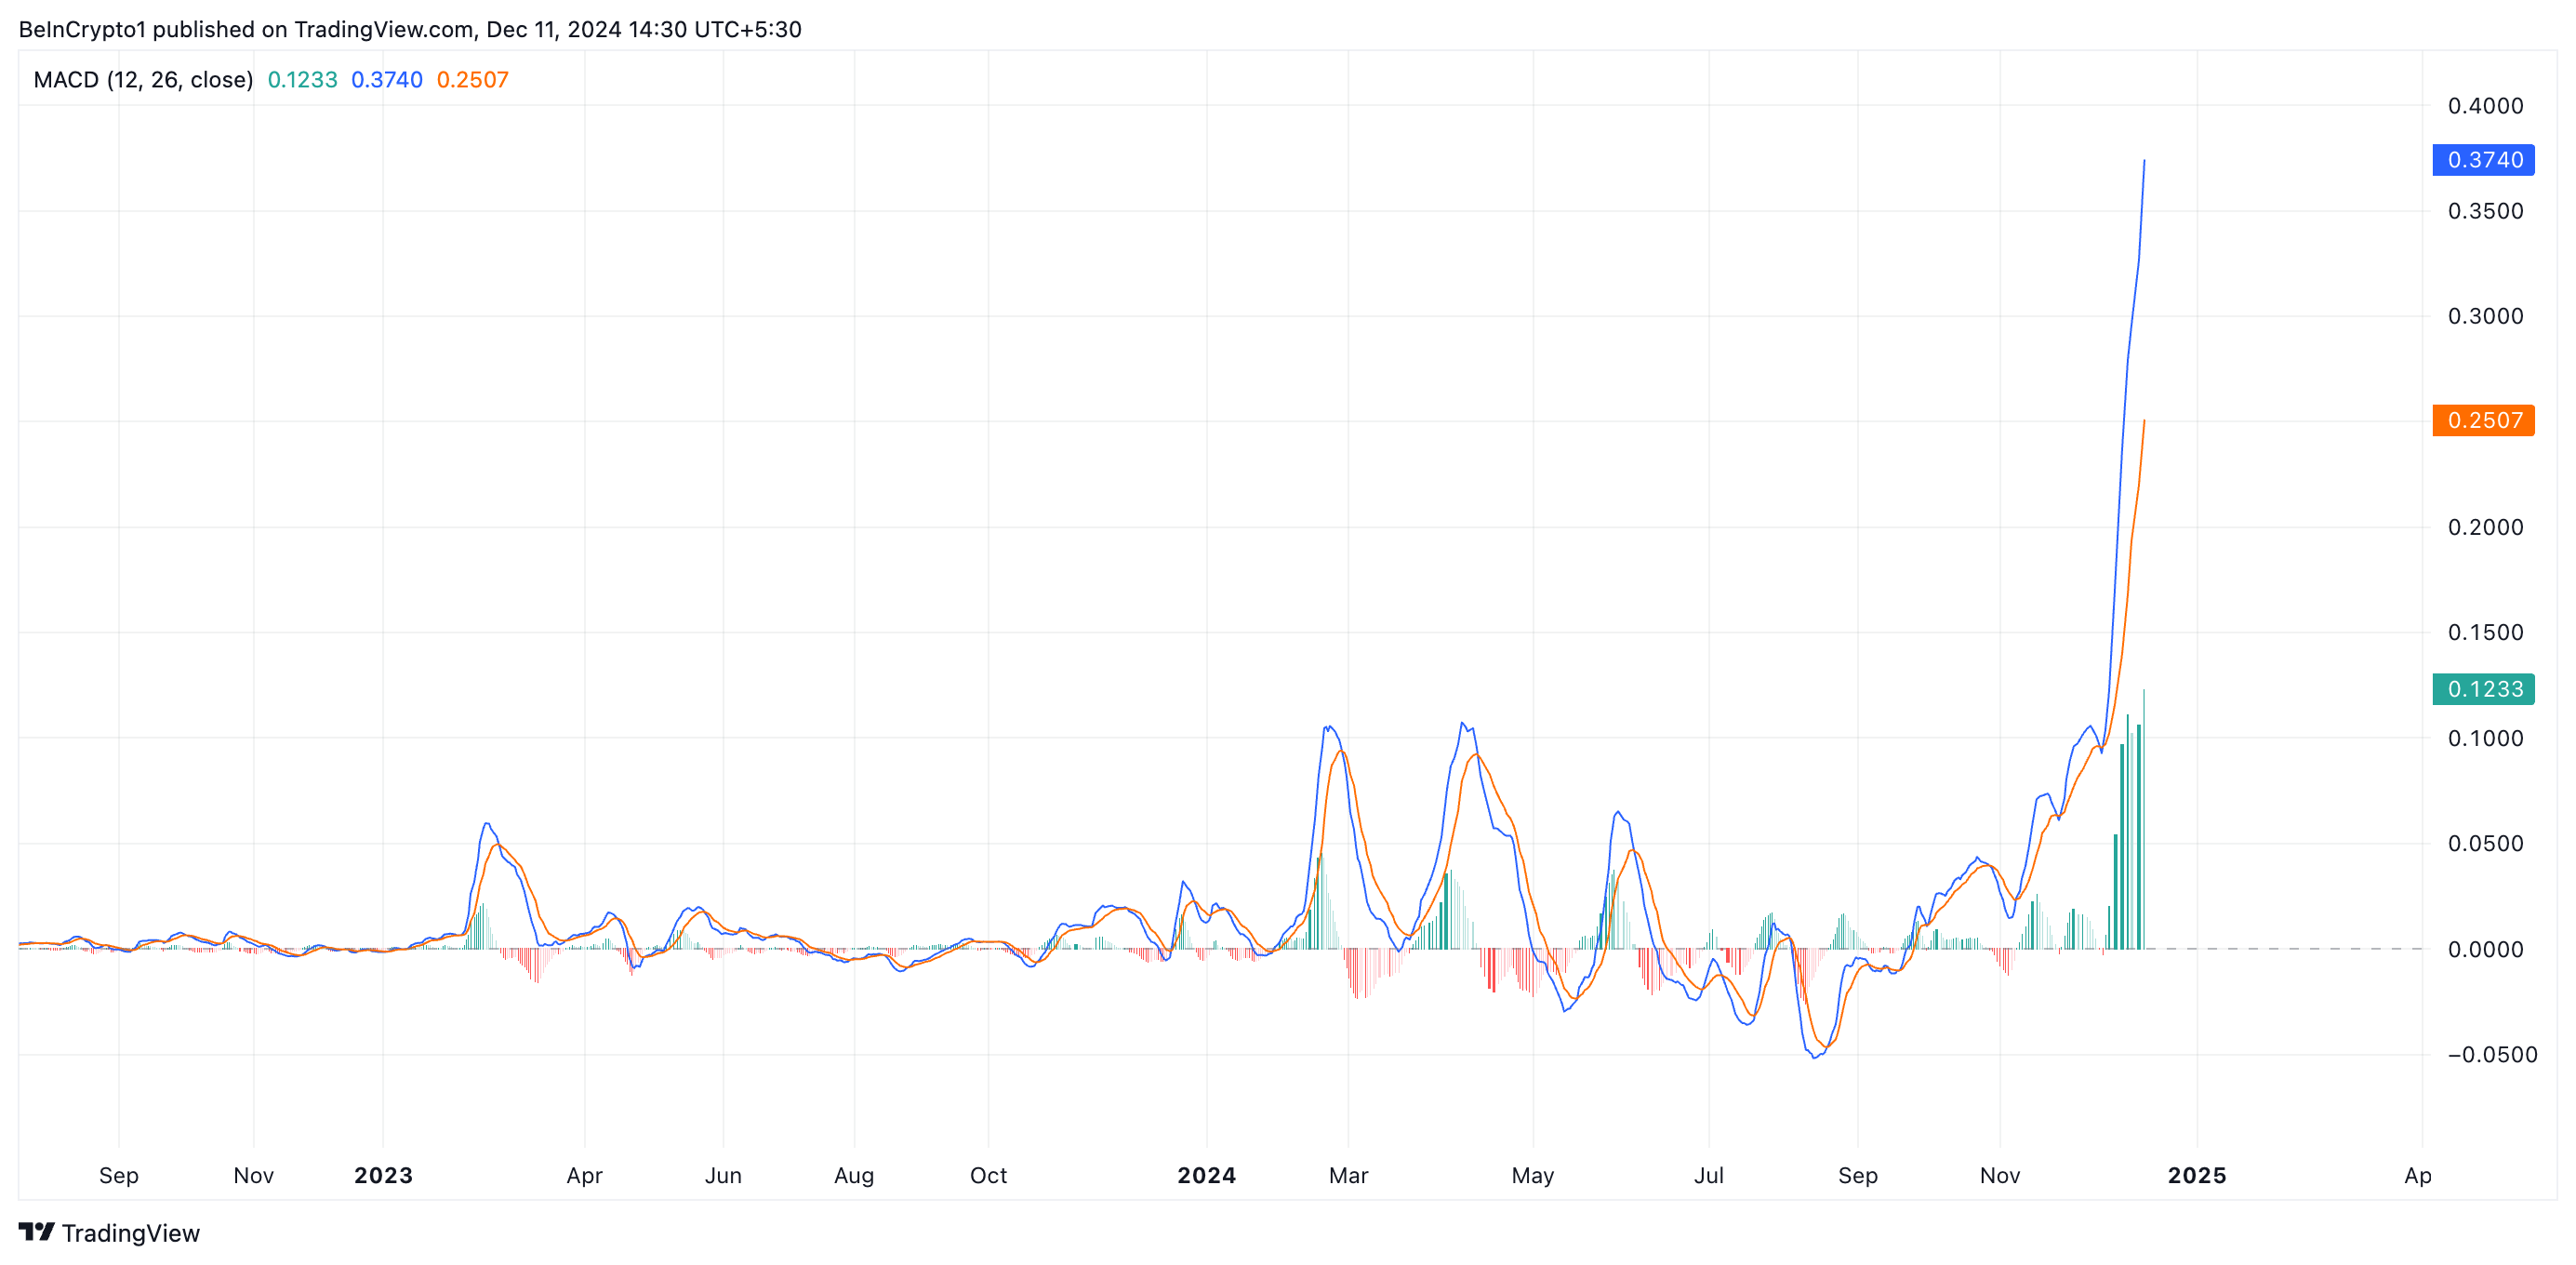
BGB’s Moving Average Convergence Divergence (MACD) supports this bullish outlook. As of this writing, the token’s MACD line (blue) rests significantly above its signal line (orange).
An asset’s MACD indicator identifies trends and momentum in its price movement. It helps traders spot potential buy or sell signals through crossovers between the MACD and signal lines.
As in BGB’s case, when the MACD line is above the signal line, it indicates bullish momentum, suggesting that the asset’s price may continue to rise. Traders often see this crossover as a potential buy signal, fueling increased token accumulation, which drives up prices.
BGB Price Prediction: Token May Surge Past New All-Time High
On a daily chart, BGB’s Chaikin Money Flow (CMF) reflects the high demand for the token. As of this writing, the indicator rests above the zero line at 0.28.
The CMF indicator measures the cumulative flow of money into or out of an asset over a specific period. It combines price and volume to show the buying and selling pressure in the market. When the CMF is positive, it indicates buying pressure, with more money flowing into the asset, suggesting that the asset may experience upward momentum.
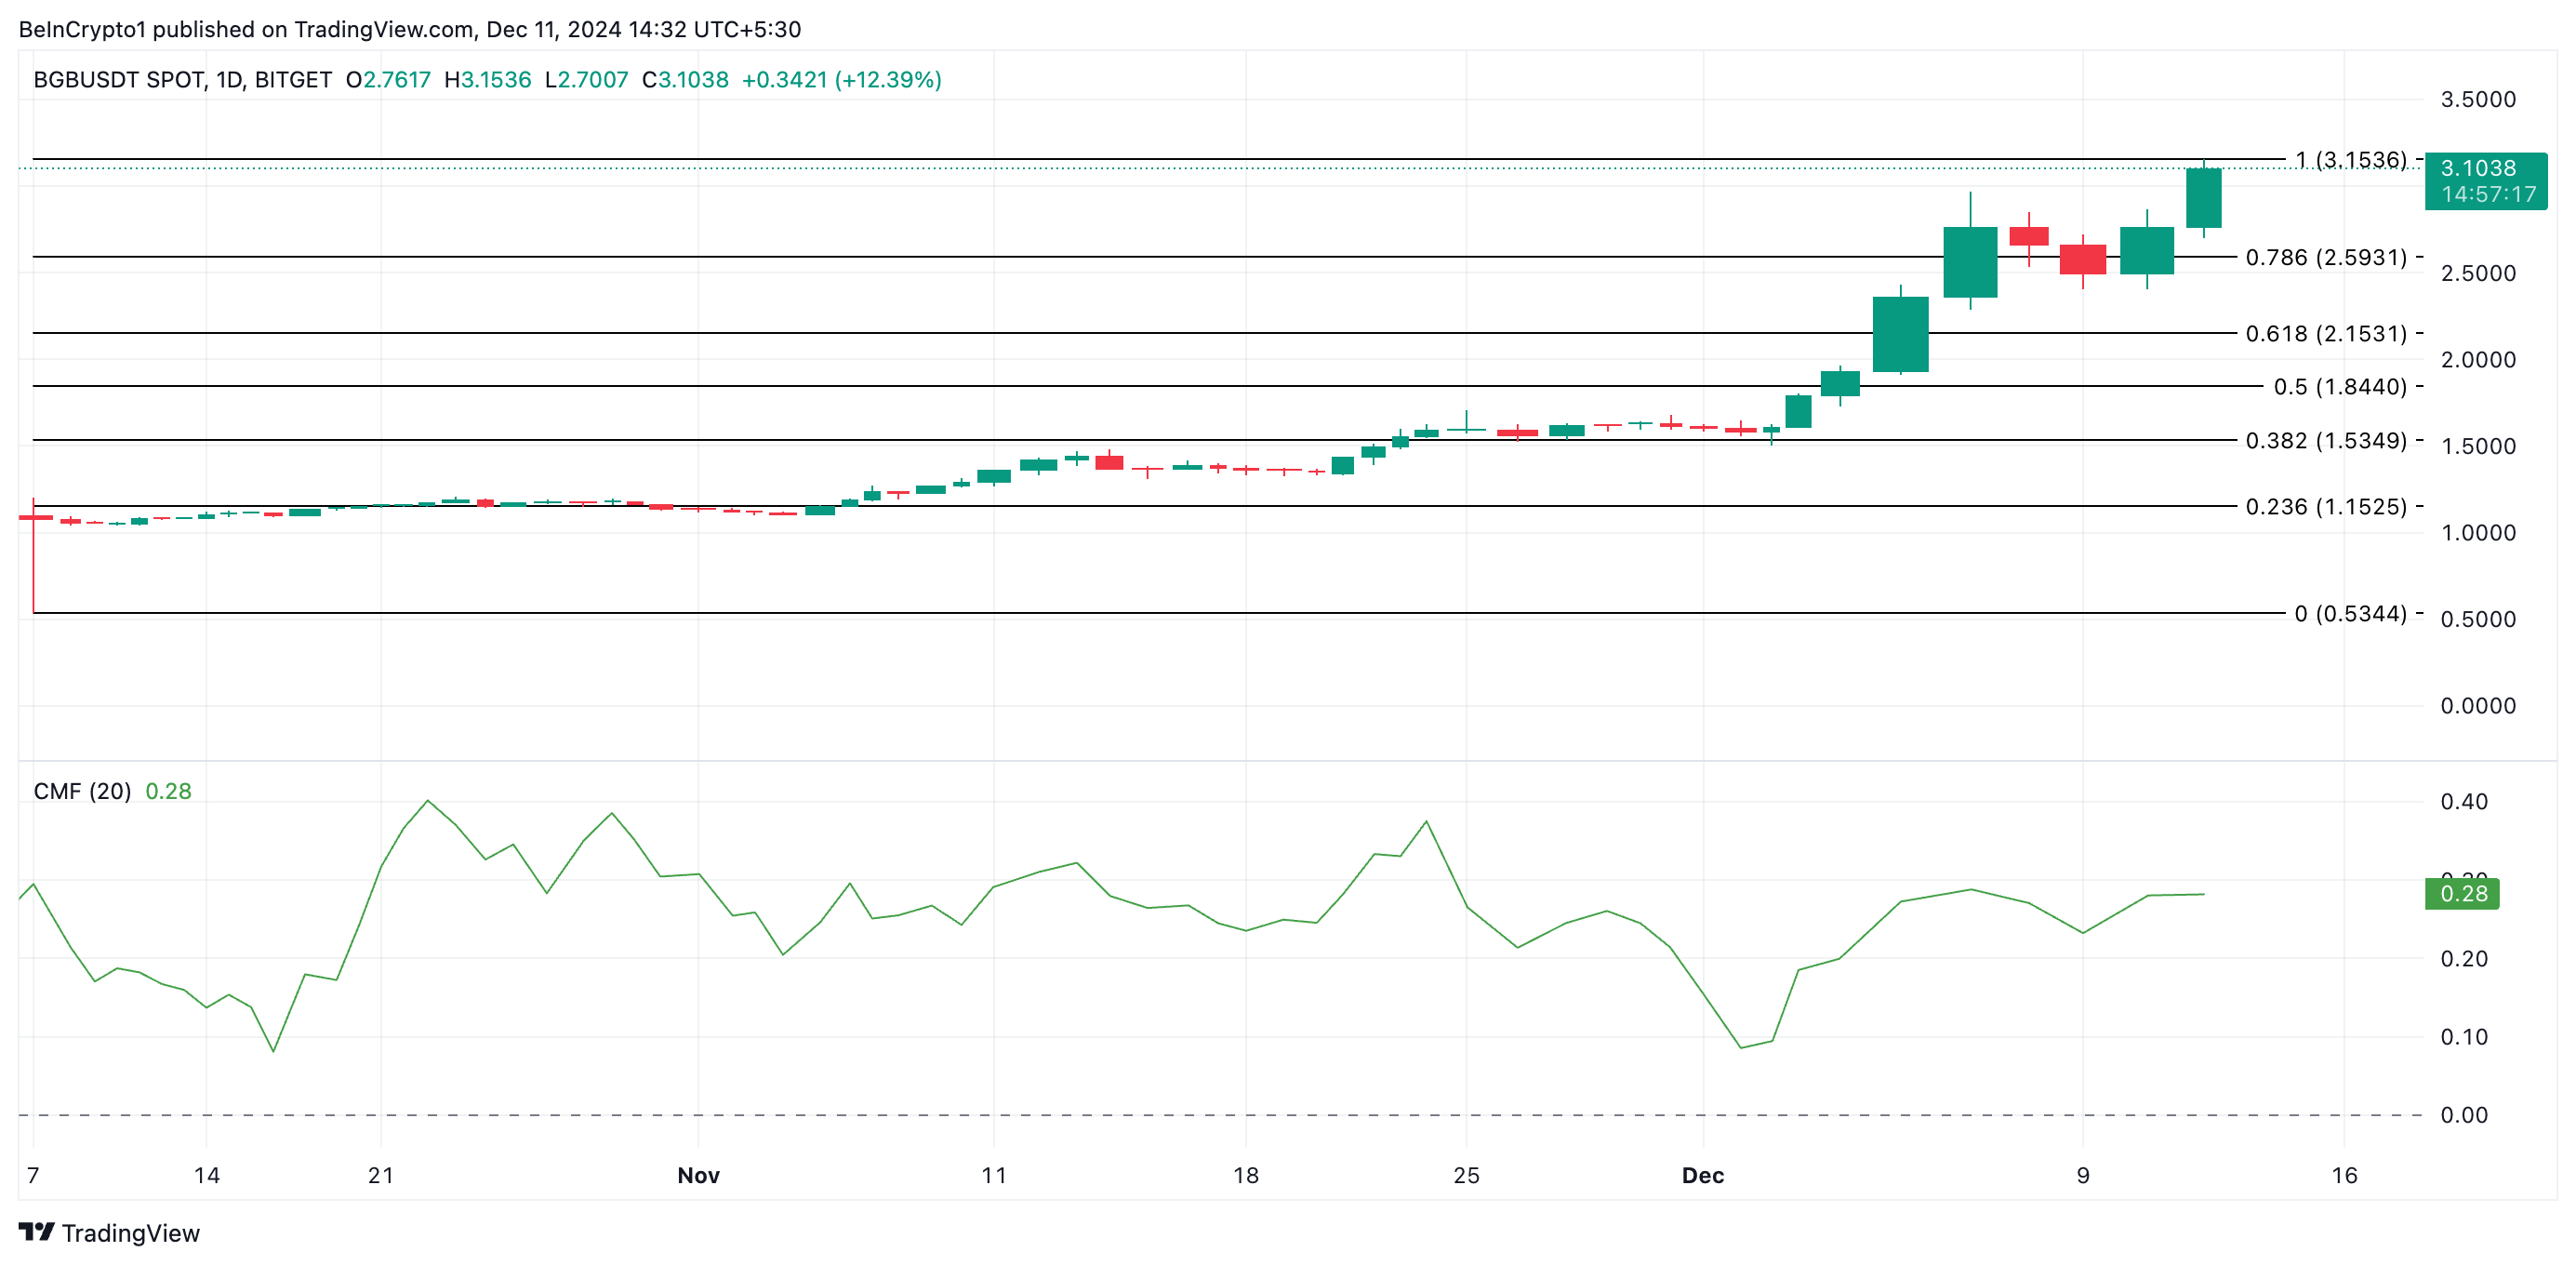
If this uptrend continues, BGB will reclaim its all-time high of $3.15 and attempt to rally past it. On the other hand, a surge in profit-taking activity will cause BGB’s price to drop to $2.59, invalidating this bullish outlook.
免責聲明:投資有風險,本文並非投資建議,以上內容不應被視為任何金融產品的購買或出售要約、建議或邀請,作者或其他用戶的任何相關討論、評論或帖子也不應被視為此類內容。本文僅供一般參考,不考慮您的個人投資目標、財務狀況或需求。TTM對信息的準確性和完整性不承擔任何責任或保證,投資者應自行研究並在投資前尋求專業建議。
熱議股票
- 1
- 2
- 3
- 4
- 5
- 6
- 7
- 8
- 9
- 10